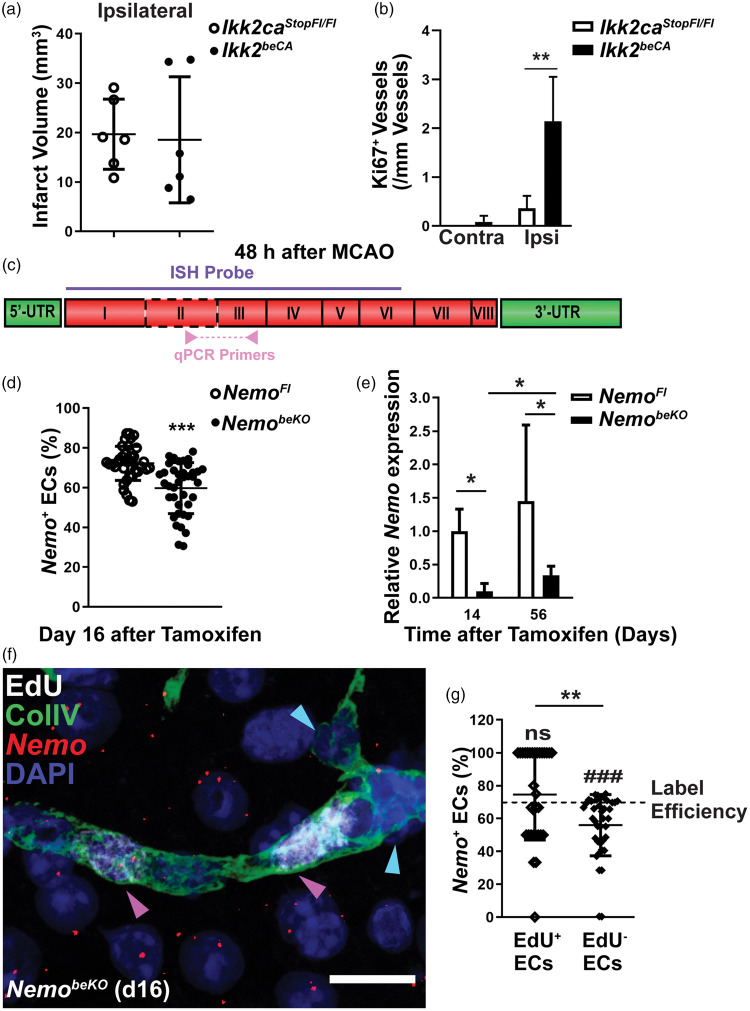
Figure 5.
NF-κB signaling promotes endothelial proliferation in cerebral ischemia. (a) Constitutive activation of IKK2 in the brain endothelium (Ikk2beCA) did not affect infarct sizes at 48 h after MCAO in comparison to Ikk2caStopFl/Fl controls (n = 6). Data are shown as means ± SD, determined by two-tailed unpaired t-test. (b) Quantification of Ki67+ vessels in the contralateral hemisphere (Contra) and penumbral area of ipsilateral hemisphere (Ipsi) revealed that the constitutive activation of IKK2 enhanced angiogenesis at 48 h in the ipsilateral but not in the contralateral hemisphere after MCAO (n = 6 mice). Data are shown as means ± SD, **P < 0.01, determined by two-way ANOVA with Bonferroni’s post-test. (c) A diagram of the Nemo mRNA transcript with eight coding exons created according to NM_001136067. The regions targeted by ISH probes and qPCR primers are indicated. Coding exon 2 (framed by dashed line) is flanked by loxP sites in NemoFl mice.18 (d) Quantification of Nemo+ ECs presented as a percentage of total ECs in ISH of NemobeKO and control cortex demonstrated a reduction of Nemo+ ECs in NemobeKO mice (38–39 fields from two animals of each group). Data are shown as means ± SD, ***P < 0.001, determined by two-tailed unpaired t-test with Welch’s correction. (e) Expression levels of Nemo mRNA that were determined by real-time qPCR in vessel fragments of NemobeKO mice and NemoFl controls (n = 4–5) at day 14 and 56 indicated a partial restoration of Nemo expression in NemobeKO mice. Data are shown as means ± SD, *P < 0.05 determined by two-way ANOVA with Bonferroni’s post-test. (f) Representative image of fluorescent ISH for Nemo mRNA combined with EdU and ColIV staining showing a vessel composed of Nemo+ and Nemo- ECs. Nemo+ ECs (magenta arrowheads) had incorporated EdU+, while Nemo− ECs (blue arrowheads) were EdU− in the same vessel. Scale bar, 20 μm. (g) The fraction of Nemo+ ECs was significantly lower among EdU− ECs compared to EdU+ ECs (39 fields from two NemobeKO mice were analyzed). The numbers of Nemo+ ECs in EdU+ and EdU− ECs were compared to the labeling efficiency of Nemo ISH in NemoFl mice from Figure 5(d) (72.3%). Data are shown as means ± SD, **P < 0.01, ###P < 0.001, determined by two-tailed unpaired t-test with Welch’s correction and one sample t-test.

