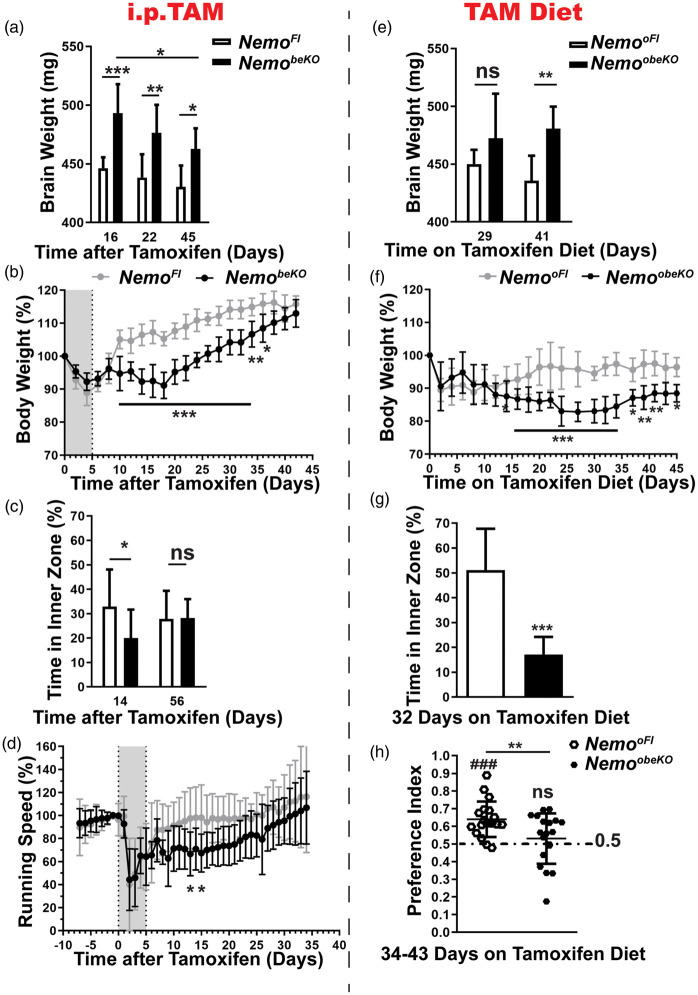
Figure 7.
Angiogenesis ameliorates pathological outcomes in NemobeKO mice. (a) Brain weight (without olfactory bulbs) of NemobeKO and NemoFl mice (n = 5–9) at three time points after the start of tamoxifen injection indicated a moderate reduction of brain edema. Data are shown as means ± SD, *P < 0.05, **P < 0.01, ***P < 0.001, determined by two-way ANOVA with Bonferroni’s post-test. (b) The body weight of NemobeKO mice dropped after starting tamoxifen injections (indicated as grey field), but recovered until day 45. Values are presented as a percentage of the body weight at day 0 (n = 5–7 mice per genotype). Data are shown as means ± SD, *P < 0.05, **P < 0.01, ***P < 0.001, determined by two-way ANOVA with Bonferroni’s post-test. (c) On day 14 after starting tamoxifen injections, NemobeKO mice spent less time in the inner zone of the open field than NemoFl controls indicating anxiety-like behavior but the parameter did not significantly differ at day 56 (n = 8–12 mice per genotype). Data are shown as means ± SD, *P < 0.05, determined by two-way ANOVA with Bonferroni’s post-test. (d) NemobeKO mice showed a lower locomotor activity in running wheels after tamoxifen injection (grey field) in comparison to NemoFl controls (n = 11–13). However, the activity normalized until day 30. Running speed is expressed as percentage of the mean speed on days −1 and 0. Data are shown as means ± SD, *P < 0.05, determined by two-way ANOVA with Bonferroni’s post-test. (e) The brain weight (without olfactory bulbs) of NemoobeKO mice remained stable at an increased level in comparison to NemooFl controls up to day 41 after starting the tamoxifen diet (n = 7–8 mice per genotype). Data are shown as means ± SD, **P < 0.01, determined by two-way ANOVA with Bonferroni’s post-test. (f) The body weight of NemoobeKO mice dropped during oral tamoxifen treatment and remained at a lower level in comparison to NemooFl mice up to day 45. Values are presented as percentage of body weight at day 0 (n = 7–22 mice per genotype). Data are shown as means ± SD, *P < 0.05, **P < 0.01, ***P < 0.001, determined by two-way ANOVA with Bonferroni’s post-test. (g) On day 32 after starting the tamoxifen diet, NemoobeKO mice spent less time in the inner zone of the open field, indicating increased anxiety-like behavior in comparison to NemooFl mice (n = 12). Data are shown as means ± SD, ***P < 0.001, determined by two-tailed unpaired t-test with Welch’s correction. (h) In the object place recognition test, NemoobeKO mice fed for 34–43 days with tamoxifen diet showed no preference for the displaced object and performed worse than NemooFl. The statistical results of the test between the preference index and the chance level (0.5, dashed line) are shown above the related column (n = 19 mice per genotype). Data are shown as means ± SD. **P < 0.01, ###P < 0.001, determined by two-tailed unpaired t-test and one sample t-test.

