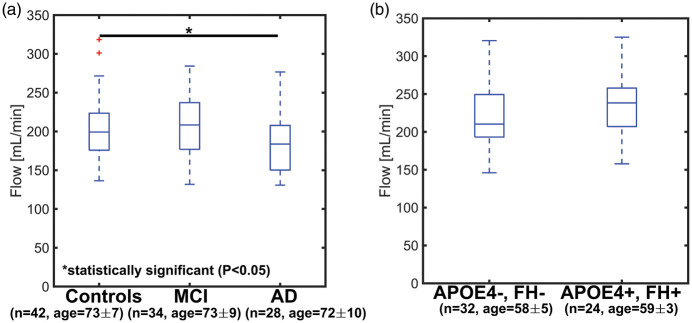
Figure 5.
Boxplots showing ICA blood flow in older age-matched controls, mild cognitive impaired (MCI), and Alzheimer’s disease (AD) subjects (a) and in middle-age APOE4+, FH+ and controls (APOE4−, FH−) (b). ICA blood flow was lowest in AD subjects with values of 206 ± 31 mL/min for older age-matched controls, 206 ± 33 for MCI, and 183 ± 29 for AD. ICA blood flow was significantly lower in AD when compared to older controls (AD vs. older controls: P = 0.046, AD vs. MCI: P = 0.059, MCI vs. older controls: P = 0.999). In the middle-aged control group, blood flow was 217 ± 32 mL/min, while flow was 237 ± 34 mL/min in the middle-aged APOE4+, FH+ group (P = 0.076).

