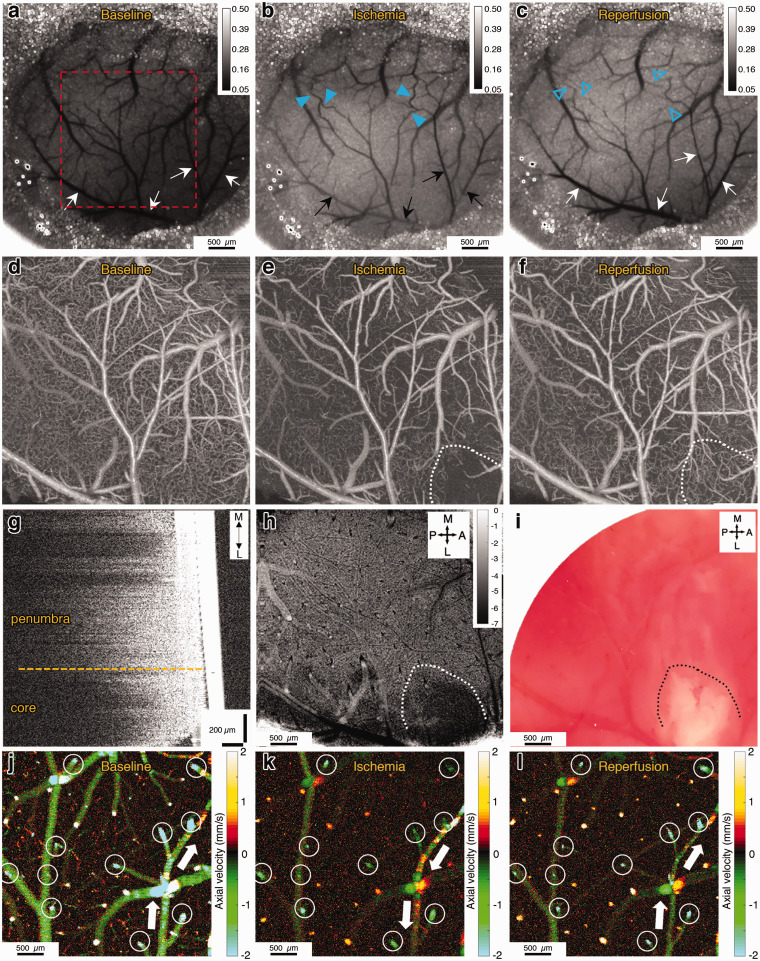
Figure 2.
(a–c) Laser speckle contrast images showing the baseline, ischemia (end of 1st h) and reperfusion (after 1 h) conditions. Black and white arrows show the pial branches of the MCA. Darker colors indicate higher flow. After occlusion, we see decreased or absent flow in the pial MCA branches, and increased flow in collateral vessels (blue arrowheads) from the ACA-supplied region. After reperfusion, we see collateral flow prominently decreases (blue empty arrowheads). Scale bars: 500 µm. (d–f) OCT angiograms (average of 10 images) of the area shown in the red square in panel (a). Only RBC-perfused capillaries are visible in those images. Ischemic core is outlined with white dotted line. Scale bars: 500 µm. (g) Sagittal cross-section showing the axial decay of OCT amplitude signal. Solid white structure on the right is the cover glass. There is reduced axial penetration of the OCT signal in the core area. (h) Signal attenuation slope map of the same region imaged simultaneously with (f). Darker pixels indicate higher (more negative) axial signal attenuation slope. Unit of calibration bar is 1/mm2. (i) The histological infarct shown by lack-of TTC staining of the brain approximately 10 min after the imaging in (i) shows overlap with the zone of reduced signal penetration. (j–l) prD-OCT images of axial velocity in the ischemic penumbra, during baseline, ischemia and reperfusion. Imaging planes are approximately 50 µm below the cortical surface, to get optimal cross-sections of penetrating arterioles. Arterioles and venules could be differentiated by their flow direction, as indicated by different colors. Negative values indicate arterioles and positive values indicate venules. Blood flow values were measured longitudinally in each penetrating arteriole (white circles) for quantification across time points. White arrows show the direction of flow in a distal pial branch of MCA, that was reversed, receiving collateral flow during occlusion and resolved after reperfusion. Scale bars: 100 µm.

