Figure 3.
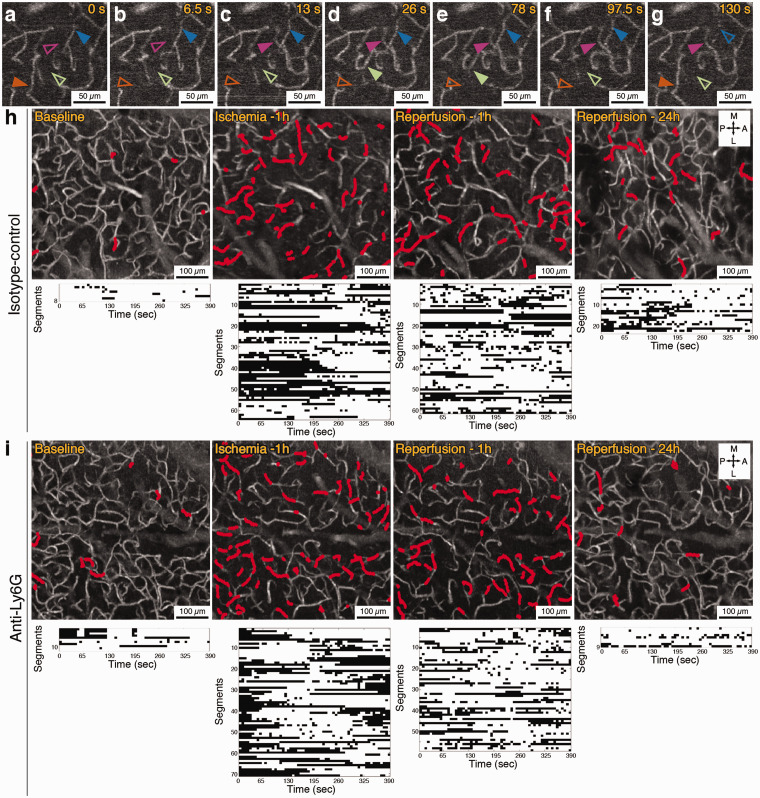
(a–g) Representative OCT angiogram time series showing capillary flow appearing and disappearing repeatedly over an observation period of 130 s in the penumbra, during 1 h of MCA occlusion. Solid arrowheads indicate that the capillary segment is flowing and empty arrowheads indicate that the segment is not flowing at that time point. Scale bars: 50 µm. (h) Capillary angiograms over penumbra zone of an isotype-control injected animal (average of 60 images, acquired over 6.5 min) with the dynamically stalling segments indicated in red. Each stall event measured in these segments is shown in the plots (the bottom row) as black dots. (i) Capillary stall profile in an animal injected with anti-Ly6G antibody immediately after reperfusion. Scale bars in (h) and (i): 100 µm.

