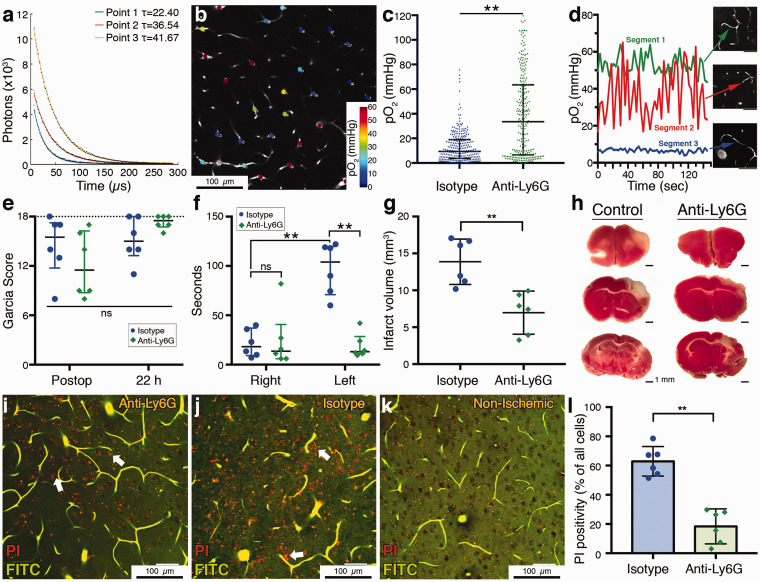
Figure 5.
(a) Phosphorescence lifetime measurements at three different points with different decay time constants (τ’s) corresponding to different pO2 values. (b) Two-photon imaging plane showing pO2 values at measurement points across the microvasculature. Scalebar: 100 µm. (c) Distribution of pO2 values in measured capillaries in control and Ly6G-treated mice (n = 3 per group) showing that anti-Ly6G-treated mice had a significantly higher capillary oxygenation. Data summarized as median-interquartile range. (d) Temporal pO2 tracings measured at three different capillaries, one with constant flow (segment 1), one with constant stall during the observed time (segment 3) and one with repetitive short-duration stalls (segment 2). pO2 partial pressure fluctuates prominently in the repeatedly stalling capillary. Scalebars: 50 µm. (e) Garcia neurological scores in the postoperative period, 1 h after recovery from anesthesia was similar in both treatment groups. At 22 h, anti-Ly6G-treated animals had relatively higher scores but the difference was not significant. Maximum possible score of 18 is indicated with the dashed line. Data summarized as median-interquartile range (f) Adhesive tape removal test indicated a significant impairment in control animals compared to the right (unaffected) side, as shown here as the time to tape removal in seconds. This asymmetry disappeared in anti-Ly6G-treated animals. Data shown as median-interquartile range. (g–h) Infarct volumes were significantly lower in anti-Ly6G-treated animals. The cortical area with lack of pink TTC staining demonstrates the irreversibly injured tissue. (i–k) Ex vivo angiograms with red propidium iodide (PI) labeling of injured cells (white arrows) in ischemic periinfarct tissue. These images are maximum intensity projections over 30 µm, at approximately 150 µm depth under cortical surface. Capillaries are visible as they are filled with a fluorescent gel containing FITC (green). Anti-Ly6G-treated animals had less PI labeling compared to controls. No specific PI labeling was observed in nonischemic brain areas (k). Punctate red fluorescence signals originate from lipofuscin granules that are normally found in neurons. Total number of cells was determined by counting of the black circular structures visible in the relatively brighter background on green channel. Scale bars: 50 µm. (l) PI positivity, as expressed by the percentage of all visible cells was significantly lower in anti-Ly6G-treated group. Significance: (**) p < 0.01, (*) 0.01 ≤p < 0.05, (n.s.) p ≥ 0.05. Sample sizes: n = 6 mice for (e–g), n = 6 regions over three mice per group in (l), n = 80–86 vessels (per animal) for six mice in (c).

