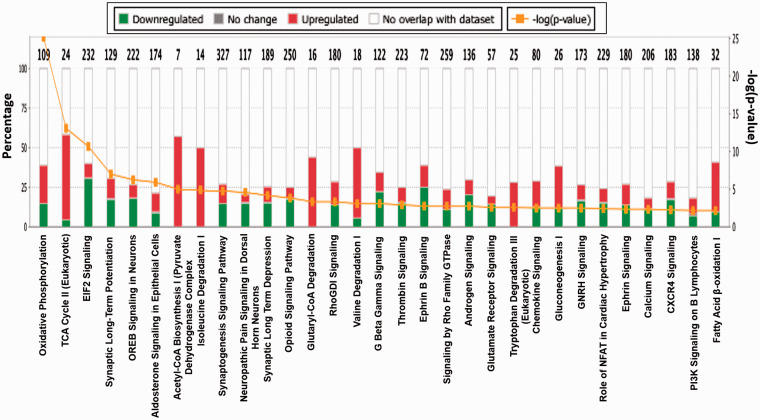
Figure 5.
Top canonical pathways exhibiting sexual disparity in MVs between male and female rats. This figure is based on proteins identified in the dataset and their known (published) regulatory associations within the listed pathways (x-axis). Bar graphs illustrate the total number of proteins in each pathway, and the number of genes differentially expressed in each pathway, indicated on the top of each bar (y-axis). The MS comparison was defined to describe female/male ratios. Green color indicates proteins more abundant in male rat microvessels, whereas red color indicates proteins more prevalent in females. The orange [−log(p-value)] line illustrates the “p-value of overlap” of the proteins in our dataset relative to IPA’s predefined canonicals. Each histogram bar can be expanded into larger canonical signaling networks within the software for further details, including protein–protein interactions (both upstream and downstream from a selected node).

