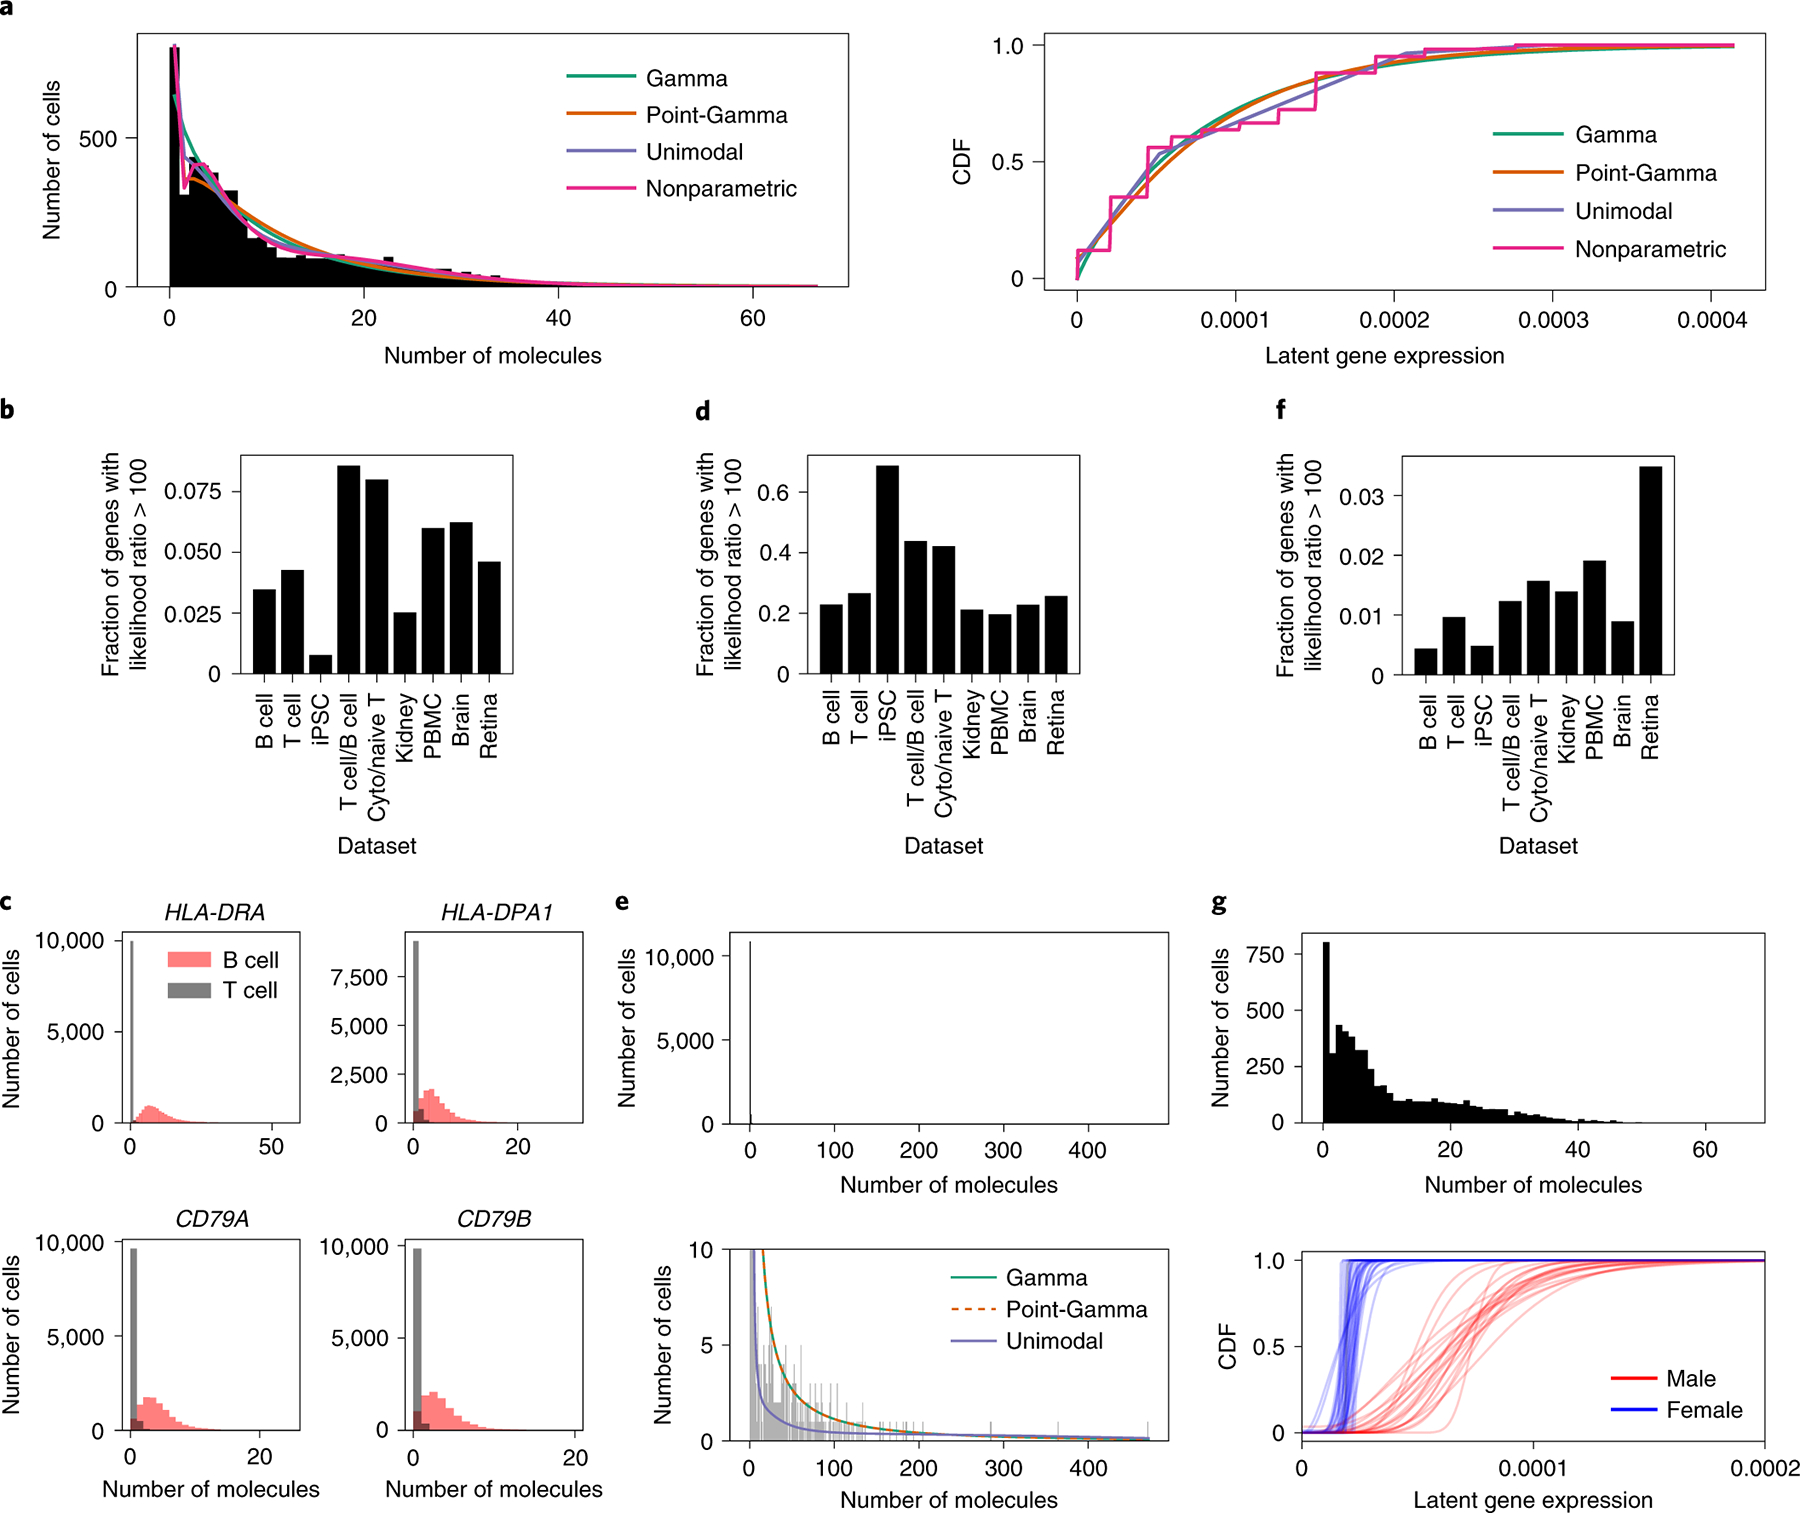
Figure 1. Comparing single-gene expression models on scRNA-seq data.

(a) Example fits of different expression models, corresponding to different observation models, to observed data at a single gene. (b) Fraction of genes in biological data sets with strong evidence for a point-Gamma expression model over a Gamma model, and (c) examples of four genes showing strong evidence in an in silico mixture of T cells and B cells. (d) Fraction of genes with strong evidence in favor of a unimodal expression model over a Gamma model, and (e) an example of a gene showing strong evidence (PPBP in PBMCs). (f) Fraction of genes with strong evidence in favor of a fully non-parametric expression model over a unimodal non-parametric model, and (g) an example of a gene showing strong evidence (RPS4Y1 in iPSCs).
