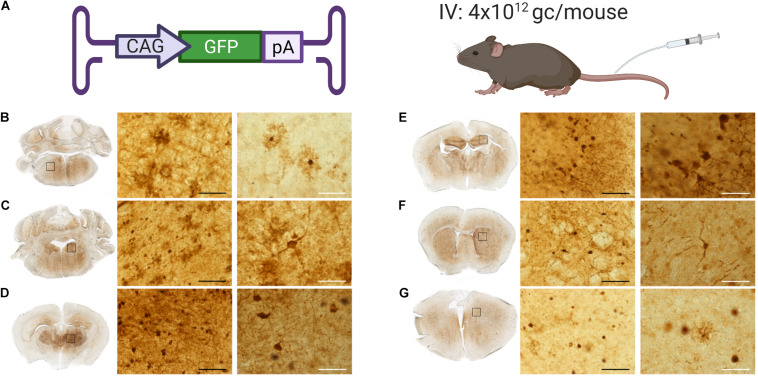
FIGURE 4.
GFP expression throughout the brain of mice administered with AAV9-PhP.B. (A) Cartoon depicting construct used, administration route, and dose used of 4 × 10¹² GC/mouse. Brains were extracted, fixed in 4% paraformaldehyde, embedded in gelatin, and serially cut by using a Vibratome to 50-μm sections. GFP protein staining (shown in brown) in (B) the medulla, (C) the locus coeruleus, (D) the thalamus, (E) the hippocampus, (F) the striatum, and (G) the cortex. Rectangles show the location of the micrograph taken. The black scale bar represents 50 μm, and white bar represents 250 μm.

