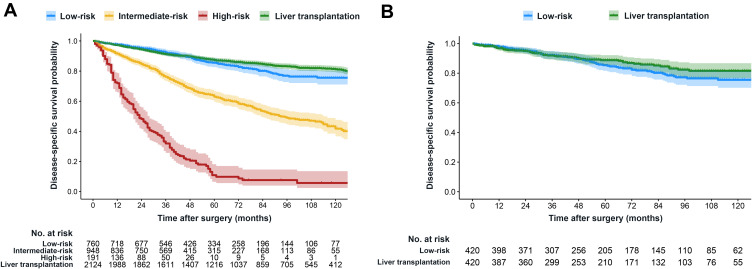
Figure 4.
Comparison of survival after resection versus transplantation before and after propensity score matching in SEER-Medicare database. (A) Kaplan–Meier curves for different risk groups stratified by the model in the SEER resection cohort (n=1899) and patients in the SEER transplantation cohort (n=2124). (B) Kaplan–Meier curves for low-risk patients treated with resection and patients treated with transplantation in propensity score-matched cohort (n=840).

