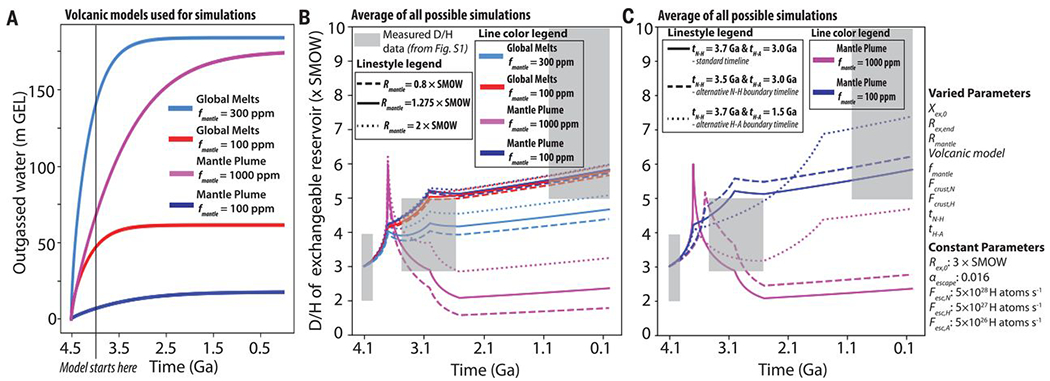
Fig. 3. Simulated D/H evolution for different assumptions of the volcanic outgassing as a function of time.

(A) Adopted volcanic models (5, 24). The Mantle Plume model (24) assumes an initial mantle water content (fmantle) of 100 ppm (dark blue) or 1000 ppm (purple). The alternative Global Melts model (24) assumes fmantle is 100 ppm (red) or 300 ppm (light blue). (B) The evolution of the D/H ratio in the exchangeable reservoir from an average of simulations with each assumed volcanic model. Line colors are the same as in (A), and gray boxes are the same as in Fig. 2. Line styles refer to assumed D/H composition of volcanic gas [dashed, 0.8 × SMOW (27); solid, 1.275 × SMOW (47); and dotted, 2 × SMOW (19)]. (C) Evolution of the D/H in the exchangeable reservoir for average of simulations with different assumptions of volcanic model and age of the Noachian-Hesperian boundary (tN-H) and the Hesperian-Amazonian boundary (tH-A) (5). These transition ages control when Fesc and Fcrust values change under our assumptions for the Noachian, Hesperian, and Amazonian periods (5). Line colors are the same as in (A). Line styles refer to the assumed timing of tN-H and tH-A (solid, standard boundary ages where tN-H is 3.7 Ga and tH-A is 3.0 Ga; dashed, tN-H is moved to 3.5 Ga; dotted, tH-A is moved to 1.5 Ga). In these simulations, Rex,end is allowed to vary.
