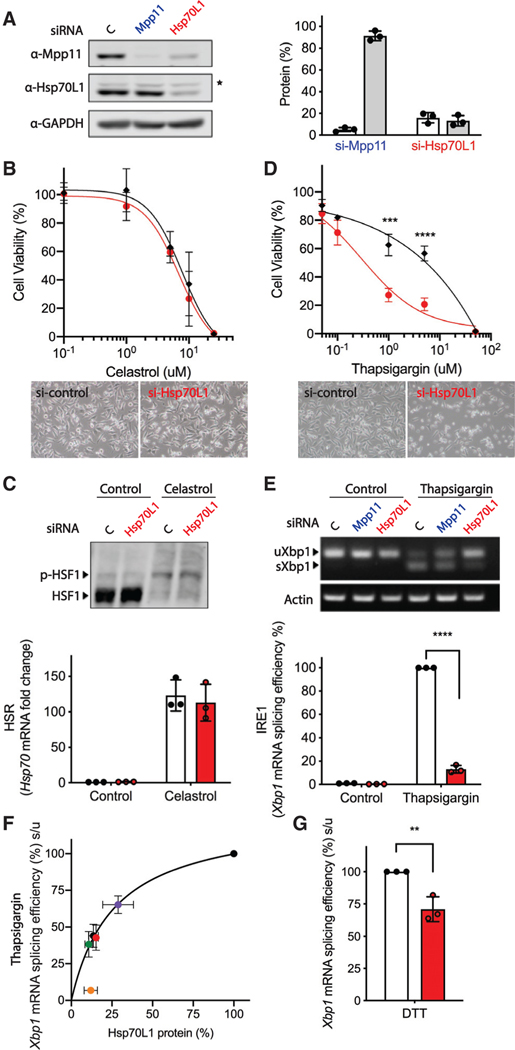
Figure 1. RAC is required for activation of the IRE1α branch of the UPR by effects on Xbp1 splicing efficiency.
Effects of Hsp70L1 knockdown on the cellular manifestations and molecular correlates of the cytosolic heat shock response (HSR) and IRE1α branch of the UPR in the ER. Cytosolic stress was induced in HeLa cells by treatment with celastrol, which induces a HSR by activating heat shock transcription factor 1 (HSF1). ER stress was induced with thapsigargin, which inhibits the sarco-ER Ca2+ ATPase (SERCA) or DTT, which alters ER lumen redox and protein folding.
(A) Representative western blot (left) and quantification of RAC components in HeLa whole-cell lysates after treatment with siRNA against either control (C), Mpp11, or Hsp70L1 for 48 h. (right) Protein levels were normalized to GAPDH, and the si-control was set as 100%. White bar, Mpp11 protein level. Gray bar, Hsp70L1 protein level. ★, non-specific band.
(B and D) Cell viability was monitored using the MTS assay in HeLa cells pretreated with siRNA against either control (black diamond) or Hsp70L1 (red circle) for 48 h, followed by 24-h treatment with a DMSO negative control, celastrol (0.1, 1, 5, 10, 25 μM) (B), or thapsigargin (0.05, 0.1, 1, 5, and 50 μM) (D). (top) Cell viability (%) was normalized to DMSO-treated si-control cells. (bottom) Representative microscopic images of cell viability.
(C) (top) Representative phos-tag gel analysis of HSF1 phosphorylation, and (bottom) qRT-PCR of Hsp70 mRNA fold change in HeLa cells pretreated with either control (white bar) or Hsp70L1 (red bar) siRNA for 48 h, followed with or without a 3-h challenge with celastrol (2.5 μM). mRNA expression levels were normalized to the internal control HPRT and are shown as fold change relative to si-control (2−ΔΔCT).
(E) Effect of RAC on UPR activation was determined by monitoring the IRE1α-branch-mediated Xbp1 mRNA splicing using (top) RT-PCR and (bottom) qRT-PCR. Relative Xbp1 splicing efficacy (%) was calculated as [(spliced Xbp1/unspliced Xbp1) normalized to thapsigargin 4 h of vehicle si-control] × 100%. n = 3; ***p < 0.001, ****p < 0.0001.
(F) Dose-response curve of Xbp1 mRNA splicing efficiency (%) after treatment with individual siRNAs and the pool of all four against different targeting sequences of Hsp70L1. Hsp70L1 protein levels were determined by western blotting. Black circle is si-c; purple, navy, green, orange, and red are siHsp70L1–1, −2, −3, −4, and the pool, respectively. n = 5. Error bars, mean ± SD. (G) RAC knockdown on IRE1 activity as monitored by Xbp1 splicing efficacy (%) after DTT 1-h challenge.

