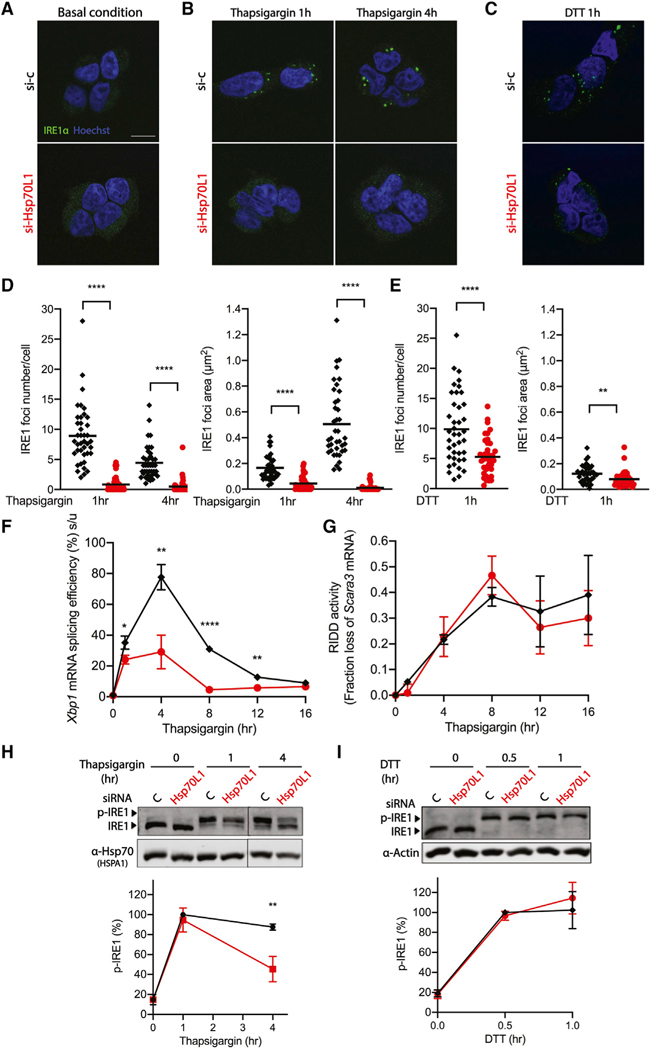
Figure 3. RAC influences the formation of IRE1α foci involved in splicing.
(A–E) Representative fluorescent images of IRE1α clustering in the T-REx293 IRE1α-GFP cell line pretreated with either vehicle control (black diamond) or Hsp70L1 (red circle) siRNA for 48 h, followed by doxycycline (50 ng/μl) to induce tagged IRE1α expression for 24 h and DMSO control (A), thapsigargin for 1 and 4 h (B), or (C) DTT for 1 h. IRE1α, green; nuclei, Hoechst, blue. Scale bar, 10 μm. Quantification of IRE1α foci numbers and foci area size after challenge with thapsigargin (D) and DTT (E) by ImageJ. Results shown are compilation of two independent replicates. Each dot represents 1 field, 20 fields were analyzed in each repeat, and an average of 60 cells was analyzed per condition in each repeat. The mean is indicated by the line.
(F and G) Xbp1 mRNA splicing efficiency (%) was monitored using qRT-PCR (F), and RIDD activity was monitored (G) by mRNA fold change of Scavenger receptor class A member 3 (Scara3) over a 16-h thapsigargin time course in RAC knockdown HeLa cells under the same conditions used for generating the fluorescent images.
(H and I) (top) Representative western blot images of IRE1α kinase activity measured by phos-tag gel (H). HeLa cells were pretreated with either vehicle control (black diamond) or Hsp70L1 (red circle) siRNA for 48 h and challenged with thapsigargin (0.5 μM) for 0, 1, or 4 h (H) or with DTT (2 mM) for 0, 0.5, or 1 h (I). Hsp70 or Actin were used as loading controls. (bottom) p-IRE1 (%) was calculated as phosphorylated IRE1/total IRE1. n = 3; **p < 0.01. n = 3; *p < 0.05, **p < 0.01, ****p < 0.0001. Error bars, mean ± SD.

