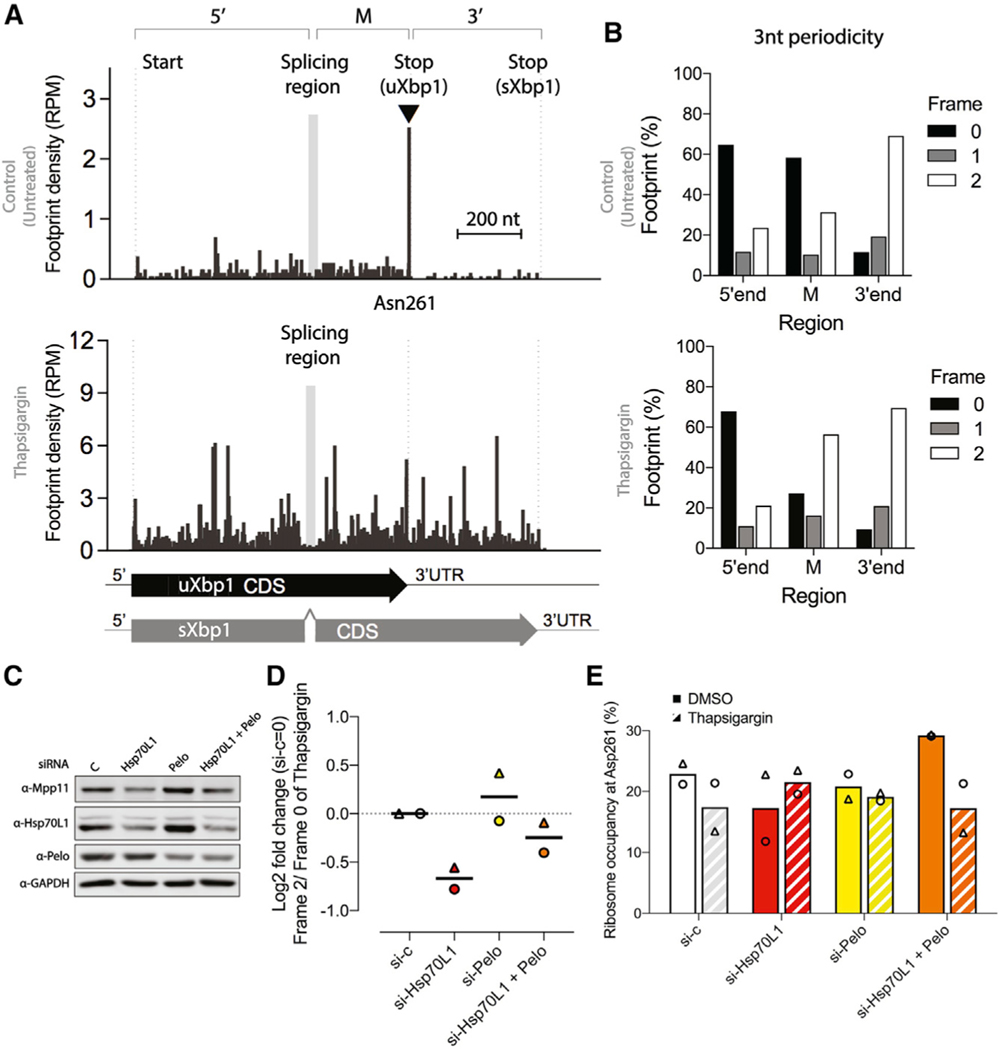
Figure 5. RAC knockdown and ribosome occupancy on Xbp1 mRNA.
(A) Relative ribosome occupancy (reads per million[RPM]) within the Xbp1 transcript from siRNA against vehicle control in HEK293 cells with footprint displayed the position of ribosome A-site. The 5’ region, from the start codon to the splicing region; the middle region M is from the downstream splicing region to the stop codon of uXbp1; and the 3’ region, from the stop codon of uXbp1 to sXbp1, are indicated above the histogram. Under basal conditions (top histogram), ribosomes predominately occupied the Asn261 site (▾) of uXbp1. After 4 h of thapsigargin (bottom), the 26-nt intron is spliced out (gray box between 5’ and M regions), causing a (+2)-nt frameshift in footprints due to reinitiation and translation of the sXbp1 mRNA and an attendant substantial increase in occupancy in 3’-end region. The left-hand dotted line indicates the start site of Xbp1. The second dotted line indicates the stop codon of uXbp1, which is just 3’ to the Asn261 site. The right-hand dotted line indicates the stop codon of sXbp1. Gray box in the histogram indicates the Xbp1 splicing region. Scale bar, 200 nt.
(B) The 3-nt periodicity of the relative footprint (%) of the Xbp1 transcript from the 5’ region, the M region, and the 3’ region from siRNA against vehicle control under basal conditions (top) or 4 h of thapsigargin treatment (bottom). In the M region, the frame 0 footprints are predicted to be from uXbp1 transcripts and frame 2 footprints from sXbp1 transcripts. A clear shift in the periodicity in the M region is observed after thapsigargin treatment, as expected.
(C) Representative western blots of knockdown efficiency. Cells were harvested after pretreatment with the designated siRNA (vehicle control, white; Hsp70L1, red; Pelo, yellow; both Hsp70L1 and Pelo, orange) for 48 h and challenged with thapsigargin (0.5 μM) for 4 h.
(D) Effects of RAC on relative occupancy on uXbp1 and sXbp1 are reflected in the Log2 fold change of frame 2 (sXbp1)/frame 0(uXbp1) in the M region after thapsigargin treatment. These changes could be due to decreased IRE1 activity or in increased stalling. siRNA against vehicle control was set as 0. The line indicates the mean from two biological replicates. Δ and ⚬ represent the individual repeats.
(E) The relative ribosome occupancy at Asn261 (%) from frame 0 footprints in the M region of the uXbp1 transcript. Bars, mean from two biological replicates. Solid bars, DMSO. Hatched bars, after thapsigargin treatment. Δ and ⚬ indicate individual repeats.

