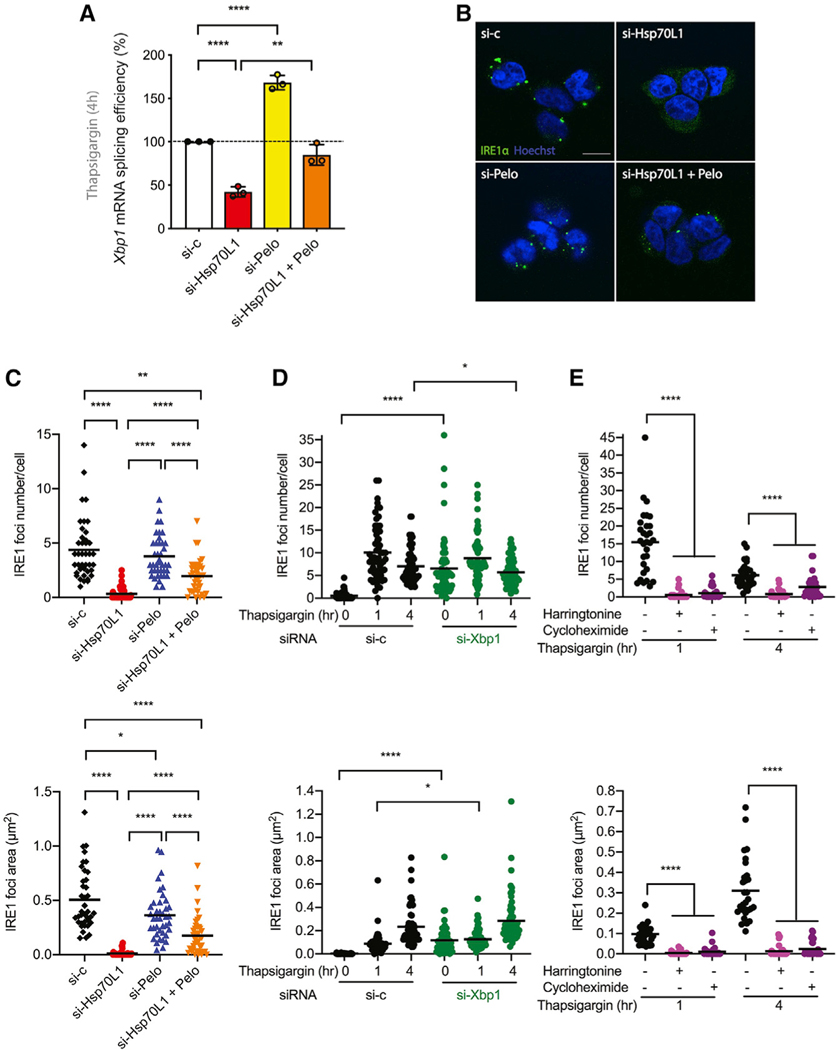
Figure 6. RAC and translation dependence and Xbp1 mRNA independence of IRE1α clustering.
Cells were transiently transfected with siRNA against vehicle control, Hsp70L1, Pelo, or both Hsp70L1 and Pelo for 48 h.
(A) Quantification of Xbp1 mRNA splicing efficiency of designated siRNA knockdown by qRTPCR after 4 h of thapsigargin (0.5 μM) treatment in HEK293 cells. n = 3. Error bars, mean ± SD.
(B) Representative fluorescent image of IRE1α foci. IRE1α, green; nuclei, Hoechst blue.
(C) IRE1α foci were monitored after challenge with thapsigargin for 4 h in the designated knockdown cells. n = 2. Foci number (top) and foci area size (bottom) by ImageJ in T-REx293 IRE1-GFP cell line after treatments.
(D) Time course of IRE1α foci formation after thapsigargin treatment compared with vehicle control (left) or Xbp1 siRNA (right) for 48 h. n = 3. (E) The translation dependence of IRE1α foci formation was examined in cells pretreated with either control (harringtonine, 2 μg/ml) or cycloheximide (100 μg/ml) for 20 min, followed by 1 or 4 h of thapsigargin (0.5 μM) treatment. Each group was compared to untreated negative control. n = 2. Each dot represents 1 field, 20 fields were analyzed for each condition, and an average of 60 cells were analyzed per condition in each experiment. The mean was presented. *p < 0.05, **p < 0.01, ***p < 0.001, ****p < 0.0001. Scale bar, 10 μm.

