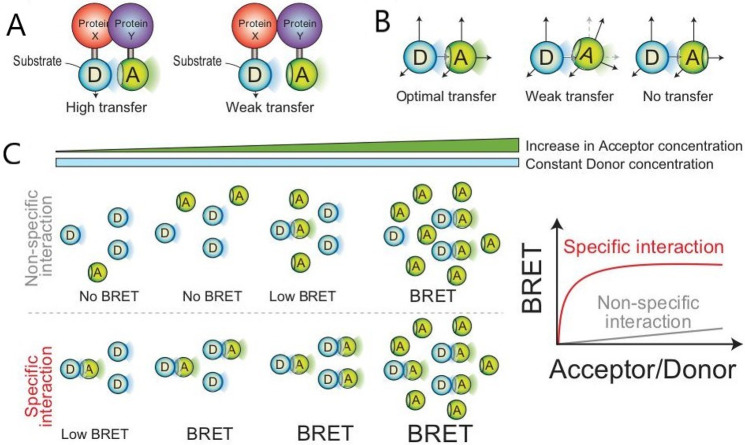
Figure 12.
Schematic representation of parameters that affect the BRET signal strength. (A) First, the distance between partners, as the distance between partners decreases from 10 nm, the signal intensity increases. (B) Second, the orientation of the acceptor, as a strong energy transfer only occurs when the dipoles of the donor and acceptor are perfectly aligned, which means peptide linkers may be required to change the insertion sites and, ultimately, the orientation of the partners. (C) Finally, with the acceptor/donor ratio, as the concentration of acceptors increases in defined spaces of organelles, there are more interactions between the partners and a stronger signal. Adapted with permission from ref (60). Copyright 2008 Wiley-VCH Verlag GmbH & Co.

