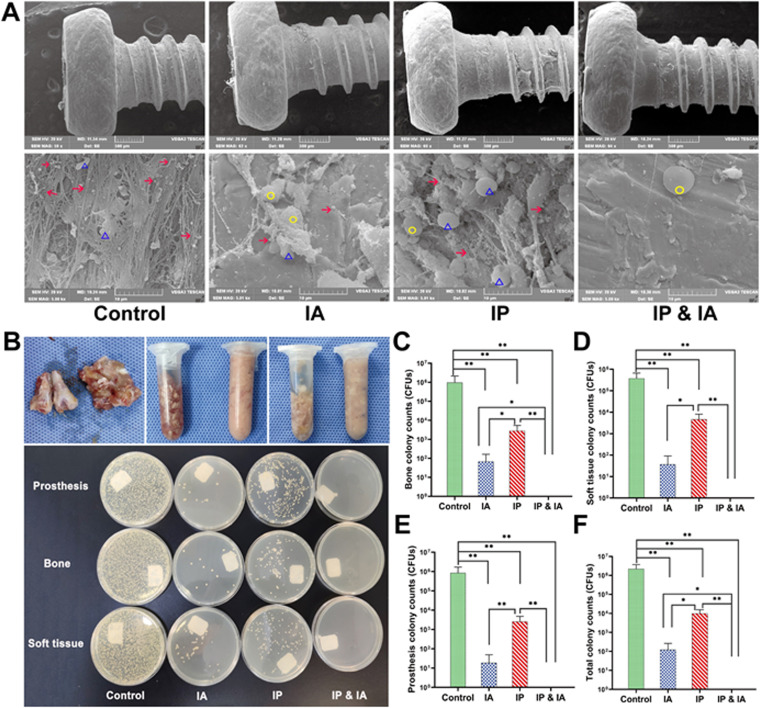
FIG 6.
Microorganisms in joint tissues of rats in each group after one-stage revision and treatment with vancomycin. (A) On day 21, the microbes on the surface of the prosthesis in each group were observed by SEM, at low magnification (×60) (upper) and high magnification (×5,000) (lower). (B) Before and after homogenization (70 HZ, 10 min) of the knee joint bone and all soft tissues around the knee (upper), images of LB agar plates of microbial cultures (37°C, 24 h) of the prosthesis, bone, and soft tissue in each group of animals (lower) were obtained. (C) Analysis of microbial culture counts for knee joint bones of animals in each group. (D) Analysis of microbial culture counts for all soft tissues around the knee joints of animals in each group. (E) Analysis of microbial culture counts for the prostheses of animals in each group. (F) Analysis of microbial culture counts for the whole animals in each group. Control (no antibiotics), IP injection of vancomycin (88 mg/kg, q12h), IA injection of vancomycin (44 mg/kg, qd), and IP and IA injection of vancomycin (combined IP treatment at 88 mg/kg, q12h, and IA treatment at 44 mg/kg, qd) were assessed. *, P < 0.05; **, P < 0.01 (n = 6). The red arrows indicate MRSA, the yellow circles indicate leukocytes, and the blue triangles indicate red blood cells. Significance was evaluated using an unpaired one-tailed Mann-Whitney test for the comparison of bacterial counts between different treatment groups.

