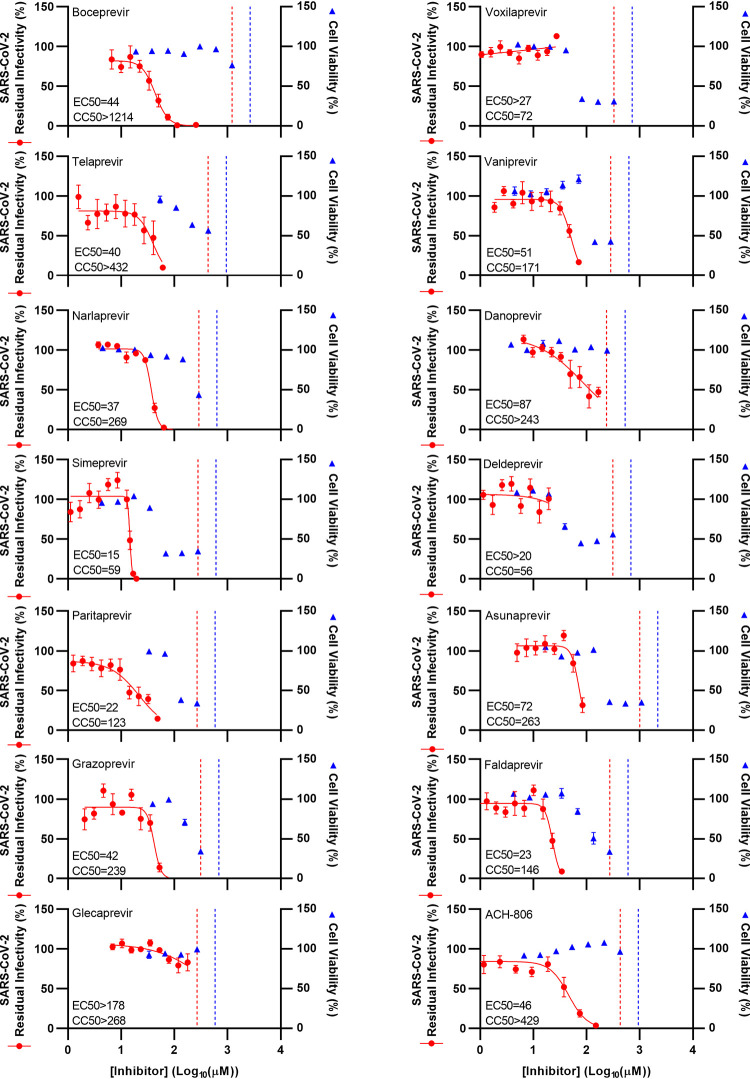
FIG 1.
Potency of a panel of HCV PIs and an HCV NS4A inhibitor against SARS-CoV-2 in Vero E6 cells. Vero E6 cells were seeded in 96-well plates and, the following day, infected with SARS-CoV-2 at an MOI of 0.002 followed by treatment with specified concentrations of the PIs boceprevir, telaprevir, narlaprevir, simeprevir, paritaprevir, grazoprevir, glecaprevir, voxilaprevir, vaniprevir, danoprevir, deldeprevir, asunaprevir, and faldaprevir as well as HCV NS4A inhibitor ACH-806, as described in Materials and Methods. After 46 to 50 h of incubation, SARS-CoV-2-infected cells were visualized by immunostaining for the SARS-CoV-2 spike protein and quantified by automated counting, as described in Materials and Methods. Data points (red dots) are means of counts from 7 replicate cultures ± standard errors of the means (SEMs) and represent percent residual infectivity, determined as percent SARS-CoV-2-positive cells relative to means of counts from 14 replicate infected nontreated control cultures. Sigmoidal concentration-response curves (red lines) were fitted and EC50 values were determined, as described in Materials and Methods. Cell viability data were obtained in replicate assays with noninfected cells using a colorimetric assay, as described in Materials and Methods. Data points (blue triangles) are means from 3 replicate cultures ± SEMs and represent percent cell viability relative to mean absorbance from 12 replicate nontreated control cultures. Sigmoidal concentration-response curves were fitted and CC50 values were determined as shown in Fig. S4 in the supplemental material. The red dotted lines represent the drug concentrations at which DMSO is expected to induce antiviral effects with reduction of residual infectivity to <70%, according to Fig. S2. The blue dotted lines represent the drug concentrations at which DMSO is expected to induce cytotoxicity with reduction of cell viability to <90%, according to Fig. S2.

