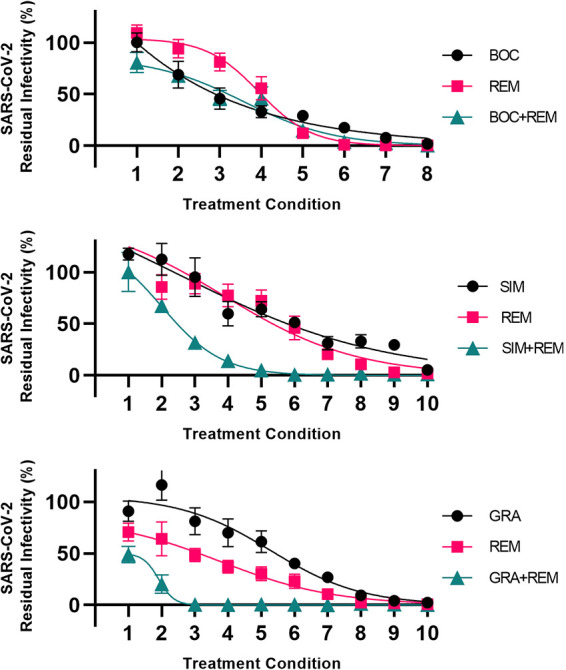
FIG 5.

Analysis of interactions of selected HCV PIs with remdesivir in A549-hACE2 cells. A549-hACE2 cells seeded in 96-well plates were infected the following day with SARS-CoV-2 at an MOI of 0.003 followed by treatment with serial dilutions of the linear PI boceprevir (BOC), the macrocyclic PI simeprevir (SIM) or grazoprevir (GRA), polymerase inhibitor remdesivir (REM), or a combination of these PIs and remdesivir, as described in Materials and Methods. After 46 to 50 h of incubation, SARS-CoV-2-infected cells were visualized by immunostaining for the SARS-CoV-2 spike protein and quantified by automated counting, as described in Materials and Methods. For each inhibitor pair to be evaluated, 8 to 10 treatment conditions were used (indicated on x axes). Each treatment condition was defined by a given concentration of PI applied singly, a given concentration of remdesivir applied singly, and a combination of these same concentrations of PIs and remdesivir, as specified in Table S2, resulting in 3 data points per treatment condition. Data points are means from 7 replicates ± SEMs and represent percent residual infectivity, determined as percent SARS-CoV-2-positive cells relative to means of counts from infected nontreated control cultures. Sigmoidal concentration-response curves were fitted as described in Materials and Methods. DMSO was kept constant in all cultures. The tested inhibitor concentrations did not impair cell viability (Fig. S8). DMSO did not induce antiviral effects in the tested concentration ranges (Fig. S2).
