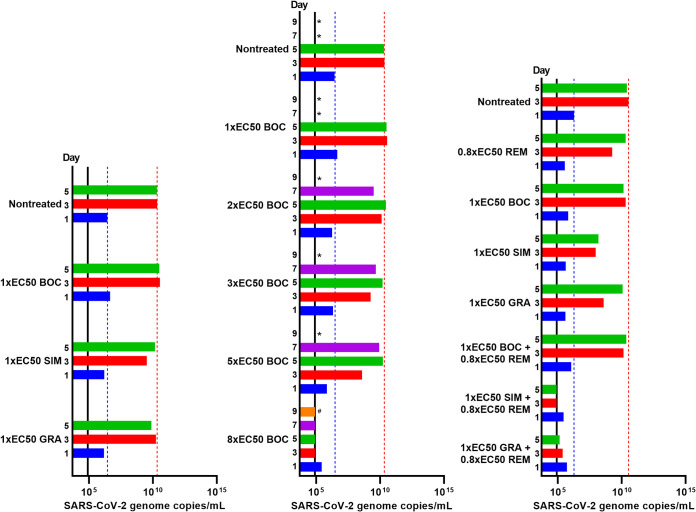
FIG 7.
Comparison of barriers to escape for HCV PIs in A549-hACE2 cells. A549-hACE2 cells seeded the previous day in T25 flasks were infected with SARS-CoV-2 at an MOI of 0.0005, followed by treatment with indicated concentrations of specified inhibitors administered immediately after infection and subsequently at the listed time points when cells were split, as described in Materials and Methods. BOC, boceprevir; SIM, simeprevir; GRA, grazoprevir; REM, remdesivir. Upon splitting of cells, cell culture supernatant was harvested and subjected to RT-qPCR for determination of SARS-CoV-2 RNA titers determined as genome copies per milliliter. The black lines indicate the LLOQs. To facilitate comparisons, bars are color coded according to the day postinfection, and blue and red dotted lines were inserted to highlight day 1 and 3 values of the nontreated culture, respectively. Cultures summarized in this figure are derived from different experimental setups, each including an infected nontreated control culture, which showed viral spread comparable to that in the depicted representative culture. (Left) Treatment with 1-fold EC50 boceprevir, simeprevir, or grazoprevir. (Middle) Treatment with 1-, 2-, 3-, 4-, 5-, and 8-fold EC50 boceprevir. *, culture was terminated due to virus- or drug-induced cytotoxicity; #, culture was maintained for a total of 13 days without indication of infection (RNA titers were around the LLOQ and no observation of single SARS-CoV-2 spike protein-positive cells). (Right) Treatment with 0.8-fold EC50 remdesivir, 1-fold EC50 boceprevir, 1-fold EC50 simeprevir, or 1-fold EC50 grazoprevir singly or with a combination of remdesivir with either of the PIs.

