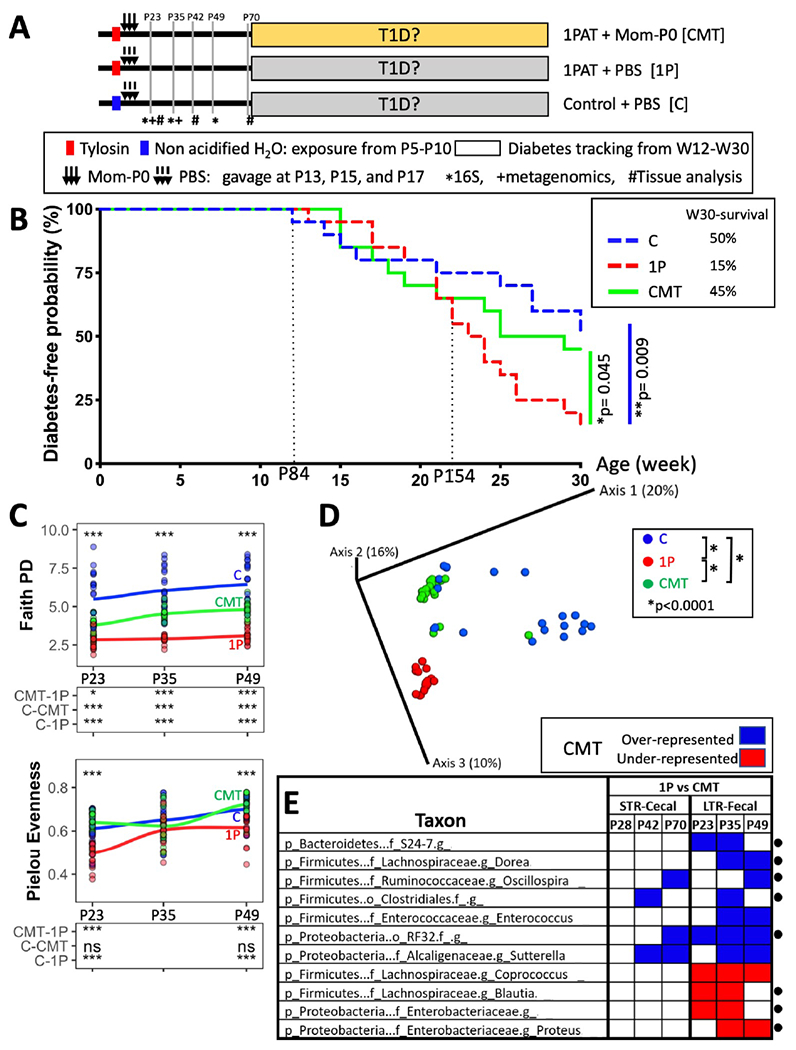
Figure 2. Effect of CMT on T1D development and early-life fecal microbiome in a longterm restoration (LTR) experiment.

A) Design of LTR experiment. Pregnant NOD/ShiLtJ male mice were randomized into three groups: Control mice gavaged with PBS at P13-17 (group C); antibiotic-treated (1P) mice receiving either PBS (group 1P) or gavages of Mom-P0 cecal contents (group CMT). Mice (n=20/group) were tested weekly for diabetes by blood glucose measurement from weeks 11-30. In addition, to provide specimens for the intermediate analyses of mechanism, 72 mice were sacrificed earlier [12 each in the C, 1P, and CMT groups at P23, and six in each group at P42 (n=18) and at P70 (n=18)]. Symbols indicate times at which the fecal microbiome was analyzed by *16S rRNA sequencing, and +shotgun metagenomic sequencing, or a subset was #sacrificed for examining ileal and cecal tissues and contents, and metabolomics. B) Kaplan-Meier analysis of T1D incidence in mice (n=20/group). The first T1D case occurred at P84; after P154, the 3 groups were clearly differentiated in T1D outcomes. Statistical significance was determined by the Gρ,γ weighted log rank test (Fleming and Harrington, 1991). Post-hoc pairwise comparisons were adjusted by a Benjamini-Hochberg procedure. C) α-diversity overtime measuring Faith’s PD and Pielou evenness. Upper panel: ***p<0.001, one-way ANOVA; Lower panel: *p<0.01, ***p<0.001, ns p>0.05, one-way ANOVA with Tukey’s HSD post-test. D) β-diversity, as determined by unweighted UniFrac analysis of the fecal microbiota of the three groups. Inter-group UniFrac distances were all significant (p<0.0001), one-way-ANOVA with Tukey’s HSD post-test. E) Early-life taxa significantly under-(red) or over-(blue) represented in either the STR or LTR experiments in CMT compared to 1P mice, according to MaAsLin2 analysis. The abundance of taxa marked with • were significantly different in 1P compared to C and also were restored by CMT (also see Figure S1A). Analysis identified a set of genera (from family S24-7, orders Clostridiales and RF32 and genera Dorea and Oscillospira) significantly decreased by 1P but increased by CMT, and also identified a set of genera (from family Enterobacteriaceae, and genera Blautia and Proteus) significantly increased by 1P but decreased by CMT. “g” indicates unclassified genus below the family or Order levels. Related to Figures S1,S2.
