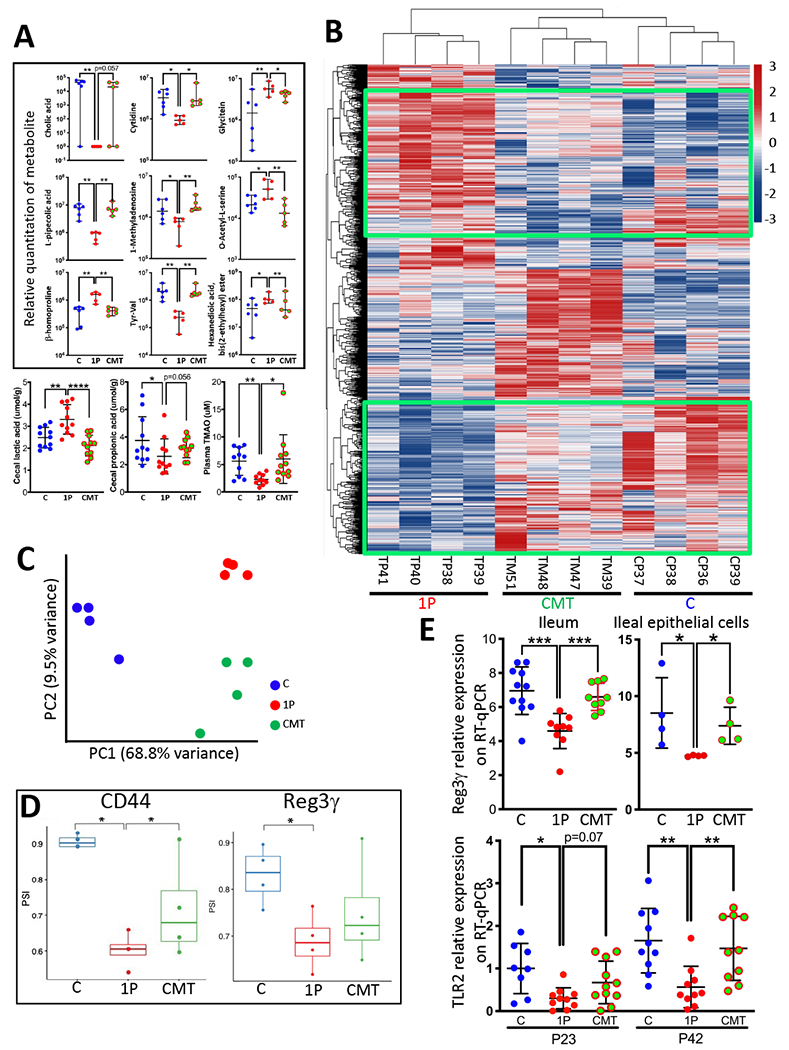
Figure 4. CMT effects on early life metabolism and ileal gene expression.

A) CMT rescues early life metabolism. Upper panels: Relative quantitation of 9 cecal metabolites, identified by untargeted metabolomics, with significant differences at P23 between the C and 1P, with restoration by CMT (n=5-6 mice/group, median±range shown). Lower panels: Quantitation of 3 targeted metabolites at P23 (n=10-11 mice/group, mean±SD shown). Cecal propionic acid and lactic acid, and plasma TMAO. *p<0.05; **p<0.01; ***p<0.001; ****p<0.0001; Mann-Whitney Utest. B) Heat map showing unsupervised hierarchical clustering of the P23 ileal genes with the most highly differentiated expression across the three groups (C, 1P, CMT, n=4 mice/group) using the Seq-N-Slide sequencing data analysis pipeline (https://github.com/igordot/sns). The green boxes highlight the specific genes that were restored in the CMT group. C) Principal Component Analysis of global ileal RNA percentage spliced-in index (PSI) distribution in the three groups: C (n=4; blue); 1P (n=4; red); CMT (n=4; green). D) Differential splicing rates for a 207-nt exon of CD44 (ID: ENSMUSE00000429028) (Left) and a 4-nucleotide retained intron of Reg3γ (between ID: ENSMUSE00000194370 and ID: ENSMUSE00001055347) (Right) in the three groups. PSI in C, 1P, CMT groups (n=4 mice/group, median±range shown). *p <0.05; Welch’s t-test. E) Expression of indicator genes, determined by specific RT-qPCRs. Top: Reg3γ expression in whole ileum (n=9-11 mice/group) and in ileal epithelial cells (n=4 independent cell collection/group) at P23. Bottom: TLR2 expression in P23 and P42 ileum (n=8-11 mice/group). Mean±SD shown; *p<0.05; **p<0.01; ***p<0.001; Mann-Whitney U test. Related to Figures S3,S4,S5,S6, Table S5,S7.
