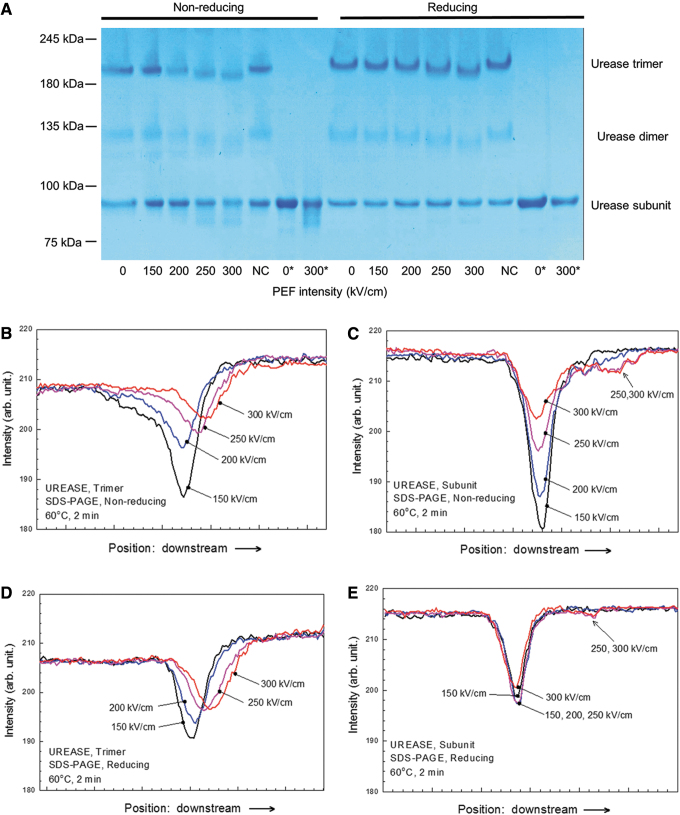
FIG. 4.
(A) SDS-PAGE results for urease treated at 60°C for 2 min under nonreducing or reducing conditions. The bands between 180 and 245 kDa correspond to the trimer, those between 100 and 135 kDa correspond to the dimer and those between 75 and 100 kDa correspond to the subunits. The numbers below the gel indicate the strength of the nsPEF. NC denotes the sample in which normal urease is dissolved in nsPEF-treated PBS. 0* and 300* denote samples that were exposed to nsPEF strengths of 0 and 300 kV/cm, respectively, and boiled at 95°C for 5 min. (B–E) Band intensity distributions from SDS-PAGE: trimer bands under nonreducing conditions (B), subunit bands under nonreducing conditions (C), trimer bands under reducing conditions (D), and subunit bands under reducing conditions (E). Since the dimer bands signals were too weak, there were no band intensity distributions of the dimer.

