FIG. 3.
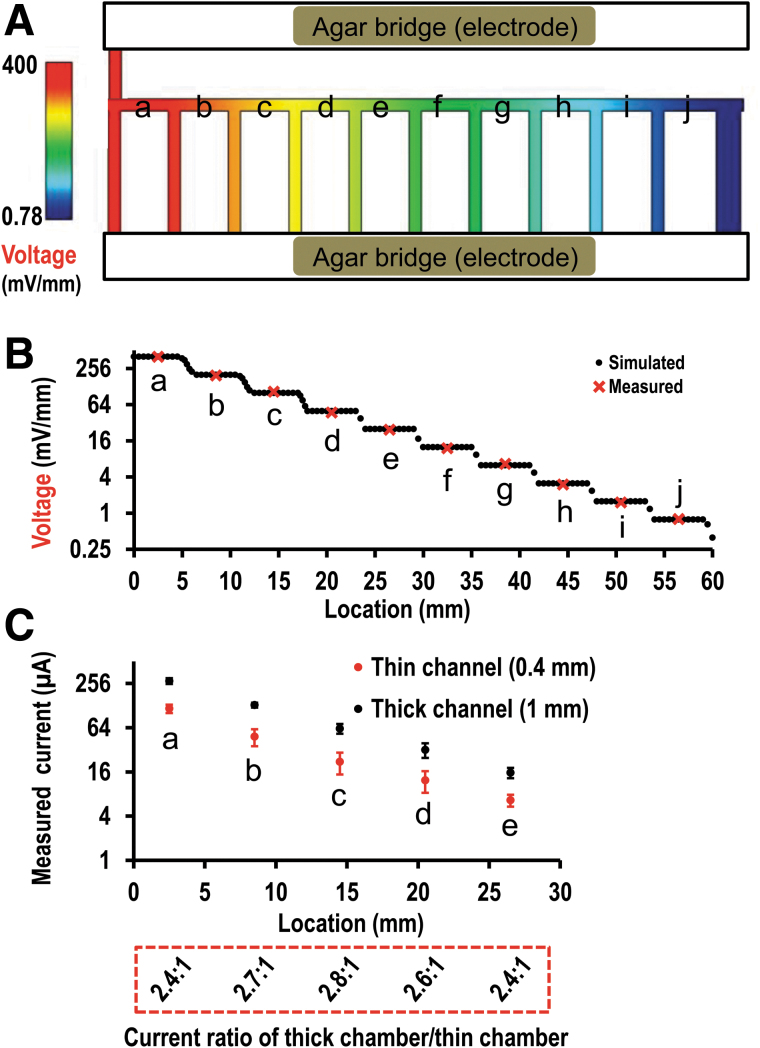
Multiple fields generated in the chip. (A) Simulated voltage gradient in the multifield chip. The maximum field was in chamber (a) on the left, in red; the minimum field was in chamber (j) on the right, in dark blue. (B) Simulated and measured field strength from chamber (a) to chamber (j). The field dropped down 50% chamber by chamber from (a) to (j). (C) Electrical currents experimentally measured in the chambers (a) to (e) either with 1 mm or 0.4 mm chamber. A larger current was on the 1 mm chamber, and a smaller current was on the 0.4 mm chamber. Value in red box was the ratio of current (1:0.4 mm), which was close to 2.5:1. The current from either 1 mm chamber or 0.4 mm chamber dropped down 50% chamber by chamber from (a) to (e). The measurement in chamber (g) to (j) was not shown because they were very small and quite close to X axis in the plot.

