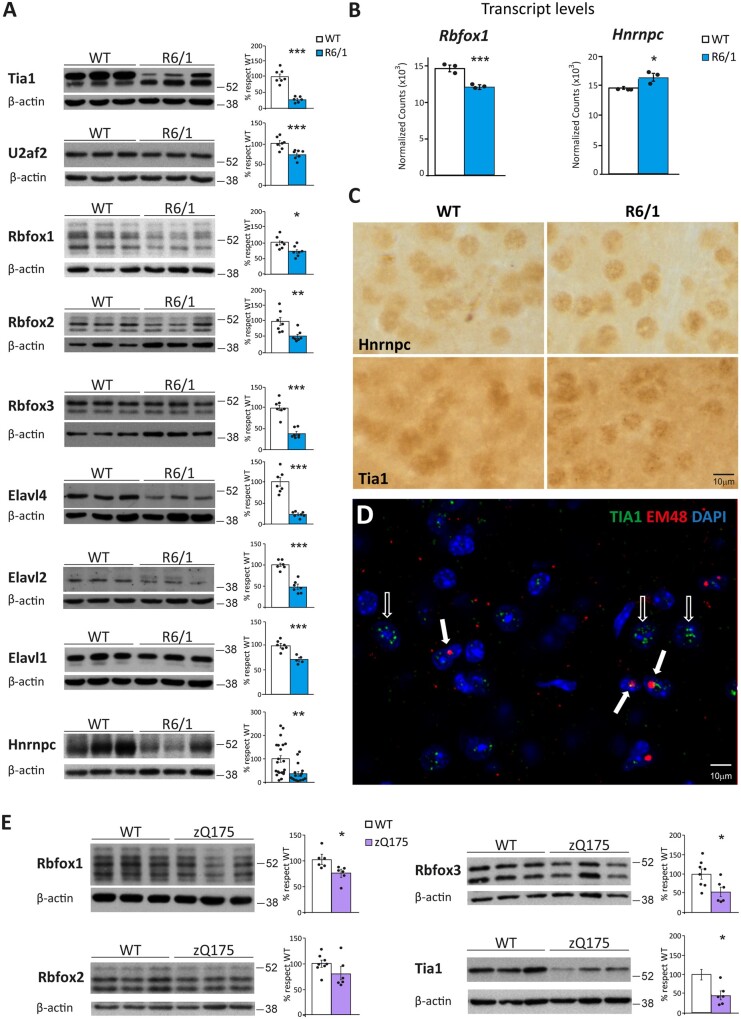
Figure 6.
Decreased protein levels of splicing factors in striatum of Huntington’s disease mouse model. (A) Protein levels in striatum of wild-type and R6/1 mice and quantifications normalized with β-actin (n = 7-20) (Student’s t-test; *P < 0.05, **P < 0.01, ***P < 0.001). Data represent mean ± SEM. (B) Messenger RNA levels of Rbfox1 and Hnrnpc in three wild-type versus three R6/1 samples, according to the RNA-seq Salmon DEG-analysis. (C) HNRNPC and TIA1 immunohistochemistry staining in striatum of R6/1 and wild-type mice. (D) Double immunofluorescence with TIA1 (green) and HTT (EM48, red) antibodies in striatum of R6/1 mice. Empty arrows show TIA1 punctate pattern in the absence of mutant HTT (mHtt) inclusions. Filled arrows show discrete co-localization of TIA1 and mHtt fluorescence in inclusion bodies. Nuclei were counterstained with DAPI (blue). (E) Protein levels in striatum of wild-type and zQ175 mice and quantifications normalized with β-actin (n = 6). (Student’s t-test; *P < 0.05). Data represent mean ± SEM.

