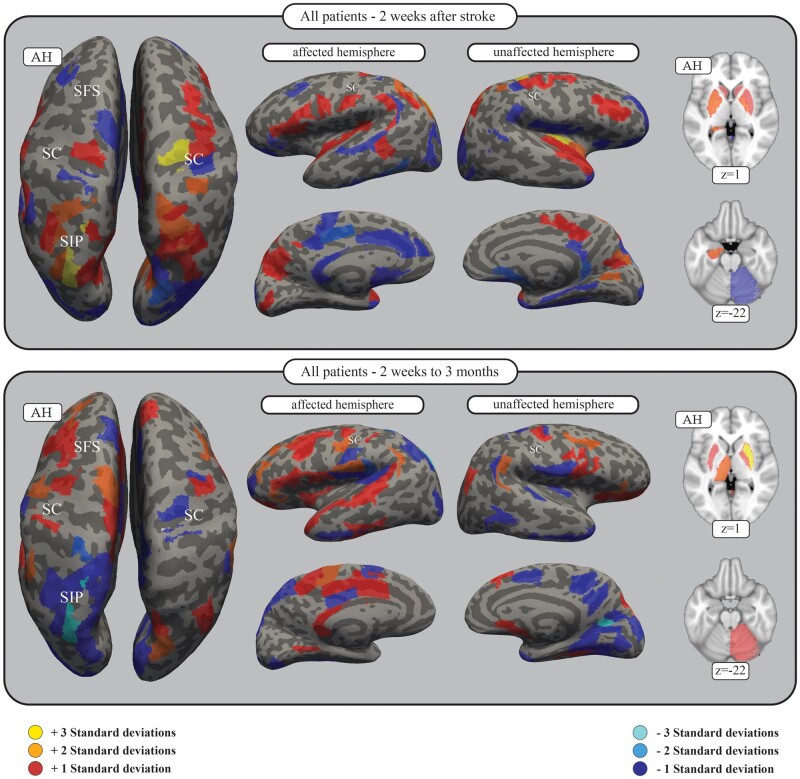
Figure 2.
SVM features of all patients for connectomes 2 weeks after stroke as well as changes observed up to 3 months. Brain areas of the connectome in which connectivity positively (red) or negatively (blue) correlates with the likelihood of the patient being a fitter. The feature weights of all connections were summed for each area of the parcellation, and a z-transform was applied. Here, only those areas exceeding 1 SD are shown. For all results, see Supplementary Table 4. The figure shows the results for the SVM including all subjects in the SEOUL dataset with the connectomes at 2 weeks after stroke (TA, top), as well as connectome changes to 3 months (TC − TA, bottom). The results are presented on the inflated FreeSurfer brain as well as the MNI standard brain, with z-coordinates given. Darker grey areas on the inflated FreeSurfer brain represent sulci, whereas lighter grey areas represent gyri. AH = affected hemisphere; SC = central sulcus; SFS = superior frontal sulcus; SIP = intraparietal sulcus.

