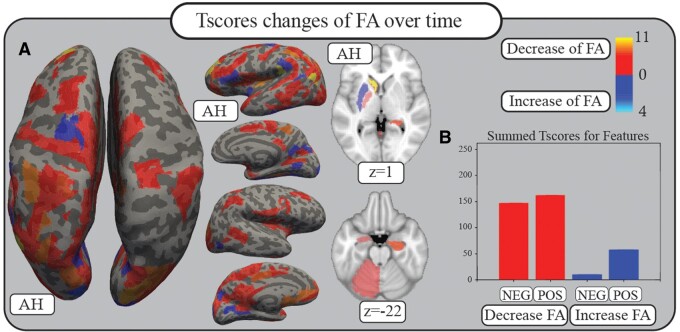
Figure 4.
White matter changes. Comparison of the FA status of each connection relevant for recovery prediction (features) at 2 weeks compared to 3 months by Student’s t-test reveals predominantly t-scores that show a decrease in FA (red). Blue colours indicate an increase in FA over time. Lacking correction for multiple comparisons, these results must be considered with caution. Numbers and colour codes represent the t-score. (A) Summed t-scores of features for each area are plotted on the inflated FreeSurfer cortex as well as the standard MNI brain with z-coordinates given. (B) Summed t-scores for weights that show a decrease or an increase in FA, separated between positive and negative features. AH = affected hemisphere; FA = fractional anisotropy; NEG = connections being negative features; POS = connections being positive features.

