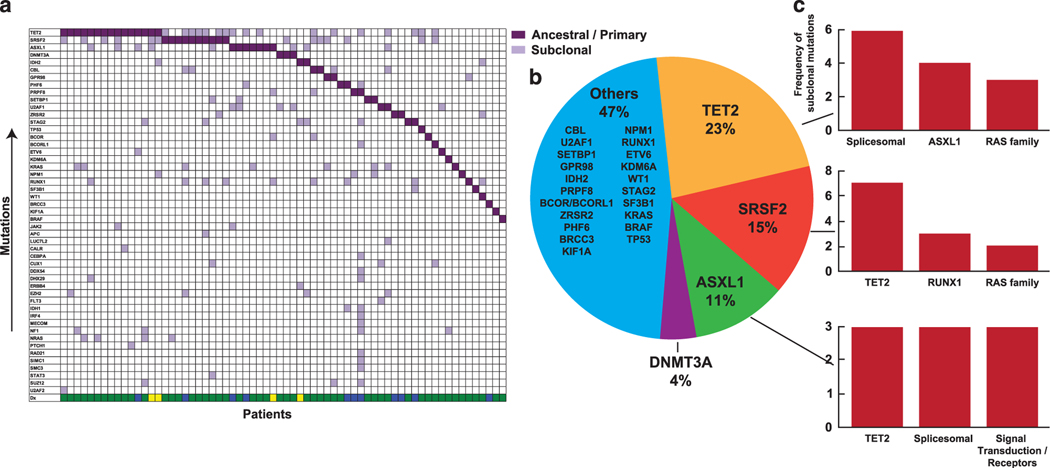
Figure 5.
Ancestral and subclonal events in CMML. (a) Distribution of ancestral mutations (purple squares vs light purple squares correspond to subclonal events per patient in a vertical arrangement or for any given mutation in horizontal lines by prevalence. (b) Pie diagram shows the distribution of the most common ancestral events. (c) The bar graphs represent the most common subclonal events for the top three ancestral events in CMML.

