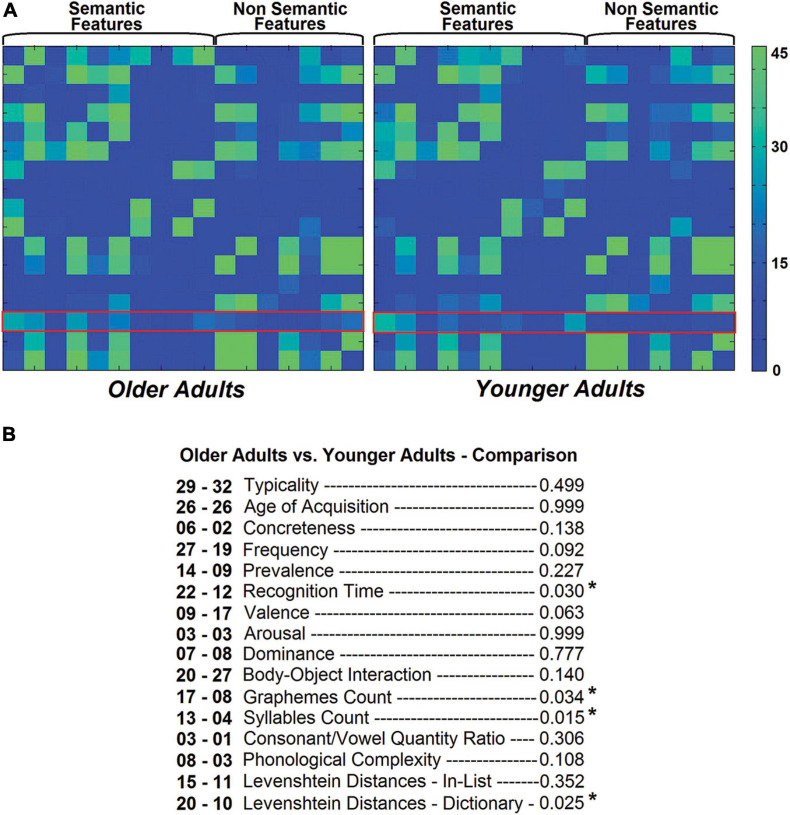
FIGURE 5.
Edge frequency in the two groups. A red frame was added to highlight the edges relevant to this study (A). A count of all these edges within each group is included below together with the outcome of the chi-square tests comparing edges between the two group frequencies, older and younger adults, respectively (B). Four pathways showed significant between-group differences. These same pathways approached or showed a trend toward significance when z-transformed correlation coefficients were analysed, as illustrated in Figure 2. Similarly, the edge toward valence approached significance in these analyses.

