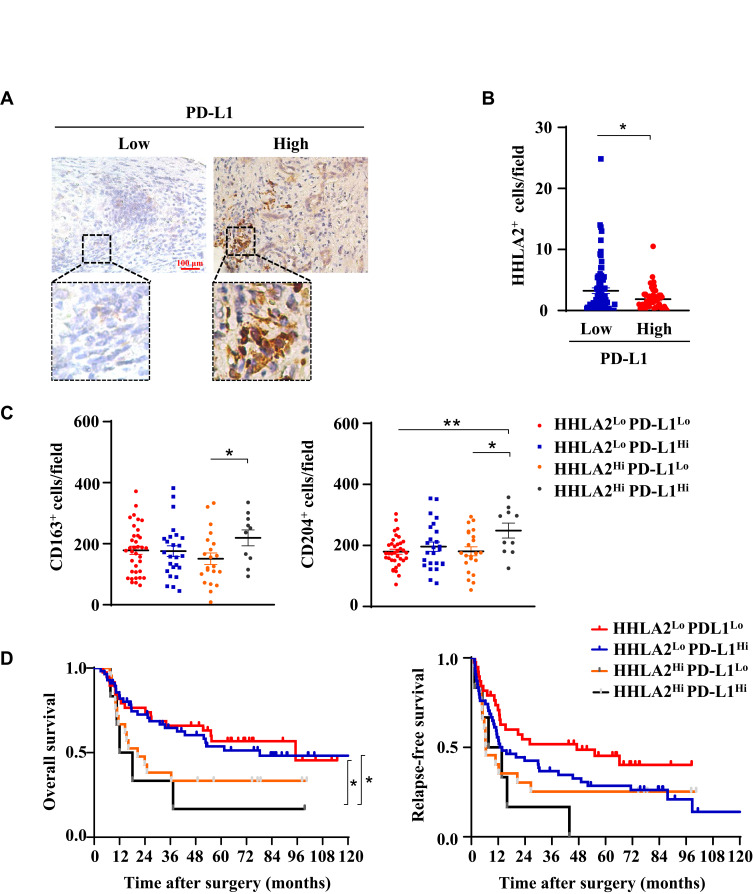
Figure 5.
Different expression patterns of HHLA2 and PD-L1 in HCC. (A) Representative images of PD-L1 expression in the peri-tumor region of HCC tissue (scale bar: 100 μm). (B) The correlation between HHLA2 and PD-L1 expression in the peri-tumor region of HCC. (C) The relationship between HHLA2/PD-L1 expression patterns, as well as the infiltration of CD163+ and CD204+ cells. (D) Kaplan-Meier curves of HHLA2/PD-L1 expression patterns in HCC patients. *P < 0.05 and **P < 0.01.

