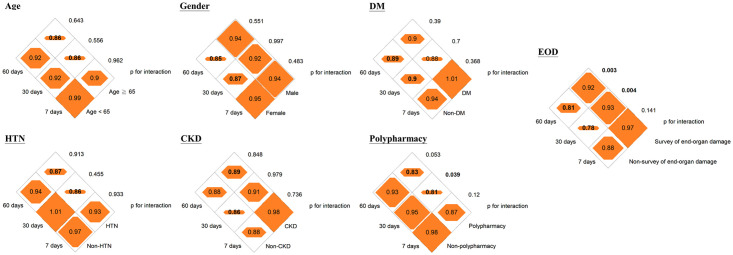
Fig 2. Diamond graphs summarize the adjusted hazard ratios (HRs) of 7-day, 30-day, and 60-day ED revisit or inpatient admission by clinical characteristics of the study population.
DM, diabetes; HTN, hypertension; CKD, chronic kidney disease; EOD, end-organ damage. Numbers in the orange diamonds stand for the adjusted HRs, where the bold numbers represent the 95% confidence interval not overlapping with null value 1.0. Detailed information is provided in the S3A Table.

