
Fig 3. Rates of soil respiration against chamber air temperature in the different sites.
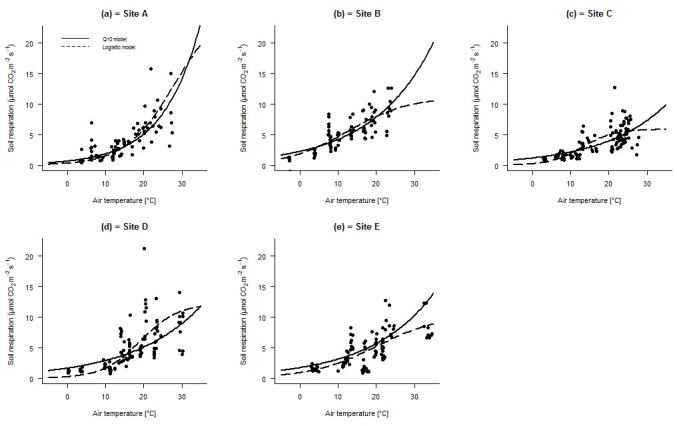
Regression lines were built using the mean values of model parameters obtained for different replicate collars of each site (n = 10).
Official websites use .gov
A
.gov website belongs to an official
government organization in the United States.
Secure .gov websites use HTTPS
A lock (
) or https:// means you've safely
connected to the .gov website. Share sensitive
information only on official, secure websites.
Regression lines were built using the mean values of model parameters obtained for different replicate collars of each site (n = 10).