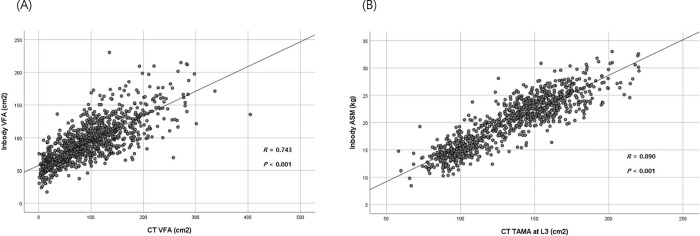
Fig 5.
(A) Correlation of VFA measured by Inbody 720 and CT scan (R = 0.743, P<0.001), (B) Correlation of ASM measured by Inbody 720 and TAMA at the L3 vertebral level measured by CT scan (R = 0.890, P < 0.001) [46]. VFA, visceral fat area; CT, computed tomography; ASM, appendicular skeletal muscle mass; TAMA, total abdominal muscle area.

