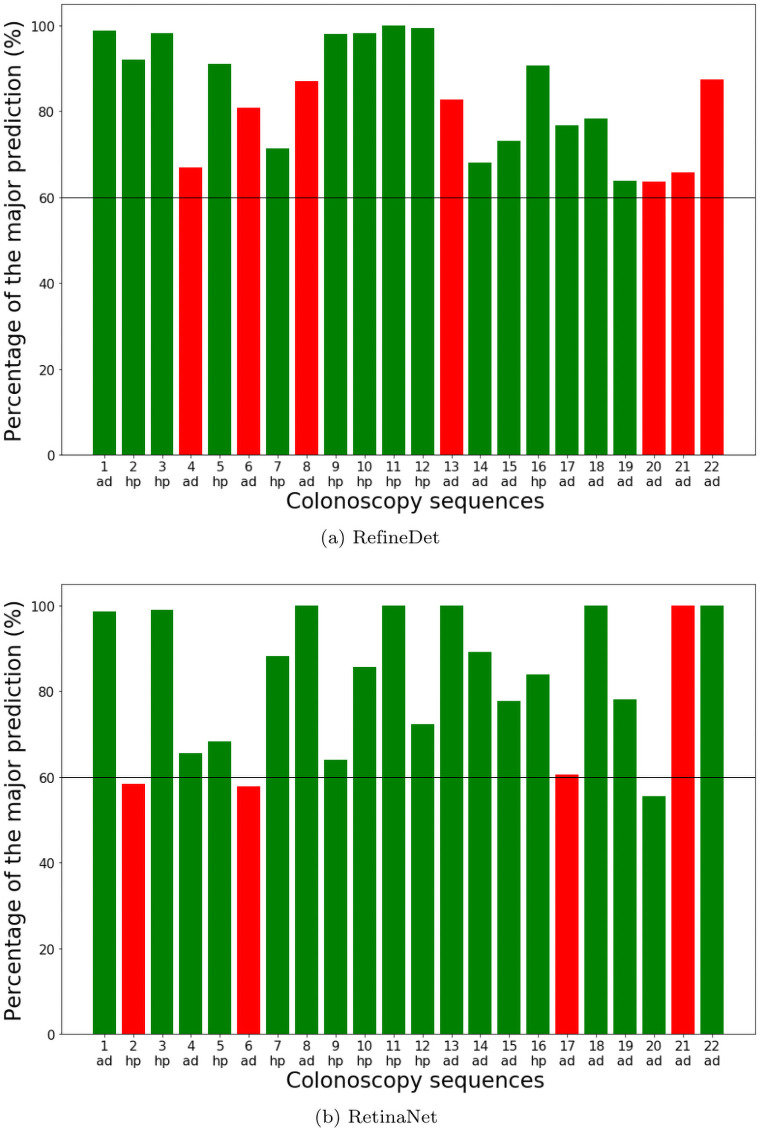
Fig 11. Percentage of the dominant class.
Detectors predict the polyp category in each individual frame. The category with more than 50% of all frames is the dominant category for that video sequence. The charts show the percentage of frames classified as the dominant class in each test sequence. (ad) and (hp) on the bottom means ground truth class adenomatous and hyperplastic respectively. Correct predictions are in green and misclassifications are in red.

