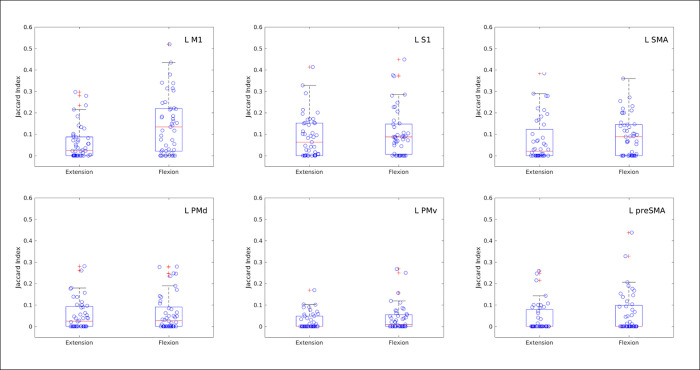
Fig 7. Box plots of the Jaccard index of similarity between pairs of participants’ sets of activated voxels preferring wrist extension or wrist flexion, as evaluated by which action yielded the larger t-statistic.
Each Jaccard index of similarity evaluates degree of overlap for two sets of voxel coordinates by calculating the ratio of intersection to union of the sets. For total overlap of two sets, the intersection equals the union so the Jaccard index is 1. Each point represents the index of similarity for voxel sets in MNI common coordinates, derived for the same wrist action, obtained from different participants. All possible pairwise comparisons of the 10 participants are shown. Different panels present results for the six left hemisphere ROIs from the Human Motor Area Template (top row: left M1, left S1, left SMA; bottom row: left dorsal premotor, left ventral premotor, left pre-SMA).

