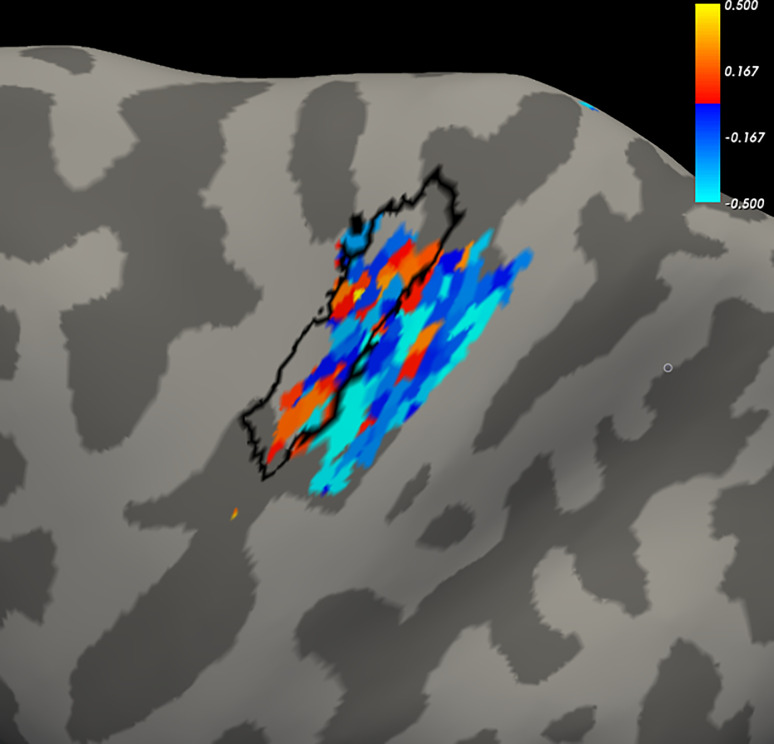
Fig 8. Subject 1 example heat map of wrist action preference (remaining individual subject data are located in the S1 File).
Surface projections of native acquisition images show left primary motor (L BA4ap) and left primary somatosensory (L BA3ab) to illustrate co-localization of voxel preferences for extension (yellow/red) and flexion (blue/aqua), as determined by the difference in percent signal change from rest. The cortical surface of the hand knob is outlined in black. Functional percent signal change was calculated for all voxel time courses. The wrist extension reference was calculated as 100 X (extension signal—baseline)/baseline; and the flexion reference was 100 X (flexion signal—baseline)/baseline. The extension and flexion signals were calculated as the mean voxel time course over the movement condition (averaged across all trials). The baseline values were calculated using the median value of the preceding and the subsequent rest periods, which were then averaged, to minimize effects of residual drift. Difference between extension and flexion was calculated for each run. Voxels were filtered using a union of t-maps for ’wrist extension versus rest’ and ’wrist flexion versus rest’ (i.e., active voxels for wrist extension, wrist flexion, or both; t threshold, p < 0.001 uncorrected, such that only suprathreshold activated voxels were considered for further analysis. Session average was the mean of the derived extension-flexion percent signal change across runs within the session.

