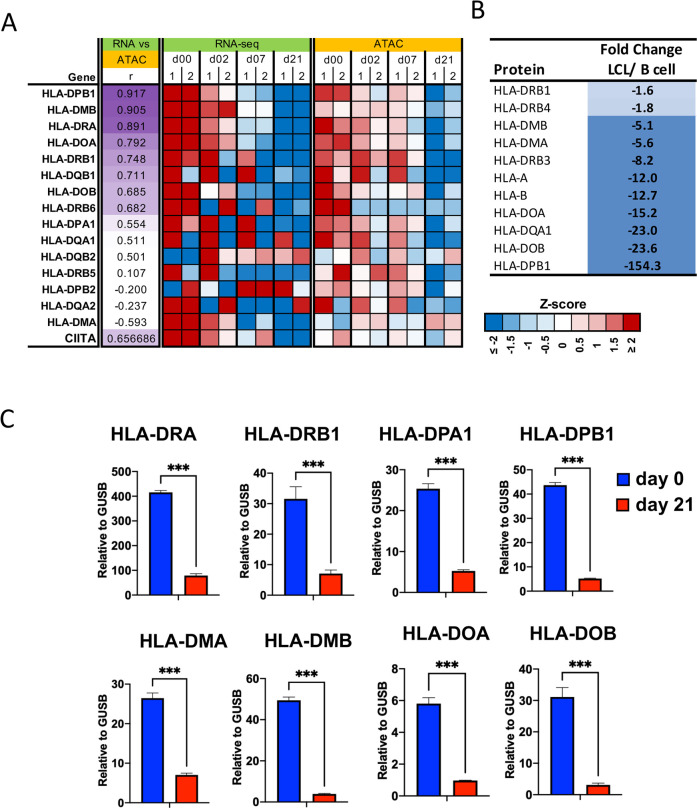
Fig 1. EBV represses transcription and chromatin of HLA class II gene cluster.
(A) Heat map of RNA-seq and ATAC-Seq data from EBV infection of primary B-cells for two independent donors. HLA-II and CIITA genes are shown that have associated changes in both transcription levels and chromatin accessibility during primary infection (r > 0.5). The intensity of purple color for column r is proportional to correlation coefficient. Intensity for gene expression and ATAC signal is a z-score calculated among samples at each experiment (lower right). (B) Proteomic analysis of HLA protein changes in EBV infected LCLs relative to uninfected primary B-cells averaged for 2 donors using label-free quantification. Color is proportional to magnitude of fold change. (C) RT-qPCR analysis of HLA-DRA, -DRB1, -DPA1, -DPB1, -DMA, -DMB, -DOA, and -DOB in B cells (Day 0) and LCLs derived from the B cells (Day 21). Statistical analysis was performed in GraphPad Prism 9. Error bars are standard deviation from mean (SDM) and *** indicates p-values <0.001 using 2-tailed student t-test.

