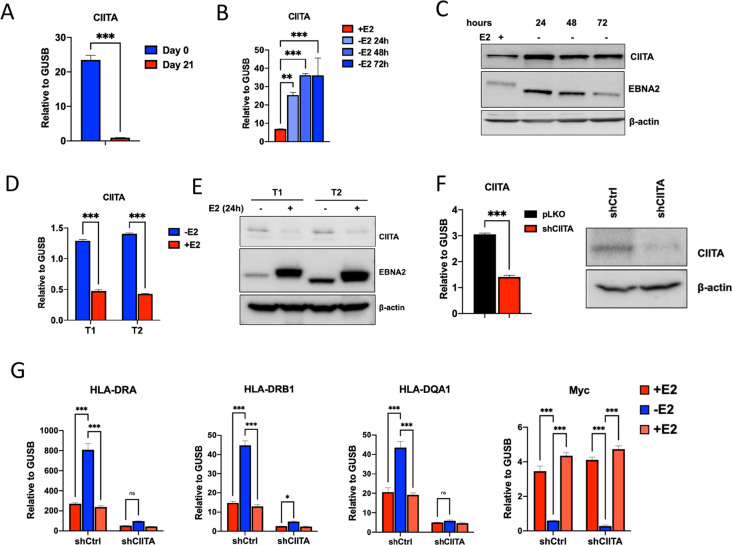
Fig 5. EBNA2 regulates HLA-II through CIITA.
(A) RT-qPCR analysis of CIITA levels in B cells (Day 0) and LCLs derived from the B cells (Day 21). (B-C) EREB2.5 cells were treated with (+) or without (-) estradiol (E2) and then assayed by RT-qPCR for CIITA expression relative to GUSB (B) or Western blot for CIITA, EBNA2 or loading control β-actin (C). (D-E) Akata T1 or T2 cells were treated with (+) or without (-) estradiol (E2) and then assayed by RT-qPCR for CIITA expression relative to GUSB (D) or Western blot for CIITA, EBNA2 or loading control β-actin (E). (F) EREB2.5 transduced with either shCIITA or control pLKO.1 (shCtrl) lentivirus was assayed by RT-qPCR for CIITA relative to GUSB (left) or Western blot for CIITA and β-actin control (right). (G) Control or CIITA knockdown EREB2.5 cells were starved from E2 for 48hrs, then replenish with culture medium containing E2 and assayed by RT-qPCR for HLA-DRA, -DRB1, -DQA1 and Myc relative to GUSB. For A-F, 2-tailed student t-test was performed to determine the significance. For G, a 2way ANOVA with Fisher’s LSD test was performed to assess significance. Error bars are SDM, and * p<0.05, *** p<0.001 or ns (not significant).

