
Fig. 1 |. Binding of LAG-3, KIR and NCR Fc constructs to HLA class II-coated beads.
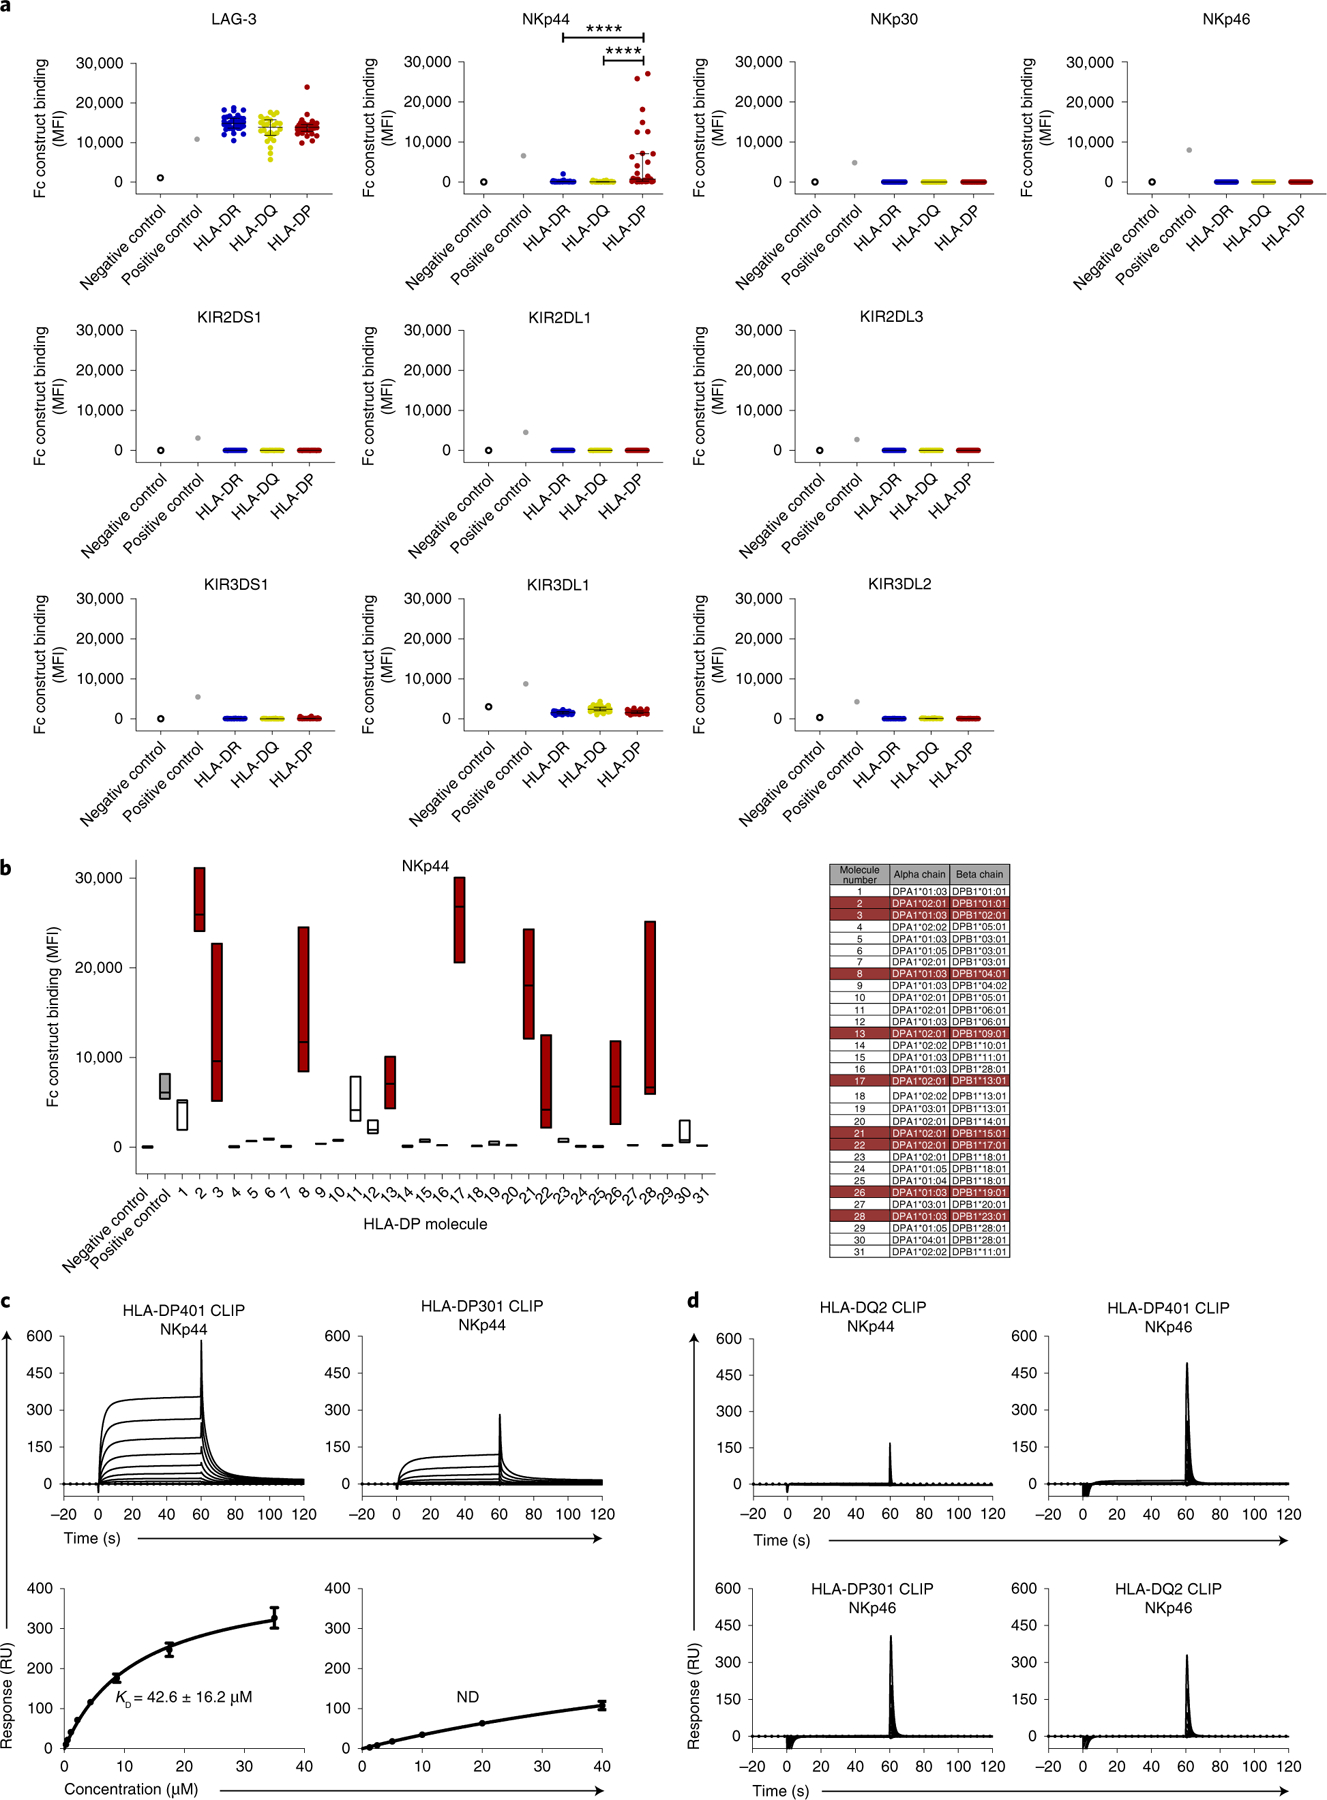
a, Fc construct binding to HLA class II-coated beads is plotted as median fluorescence intensity (MFI). All Fc constructs, except KIR3DL1 Fc construct (10 µg ml−1), were used at a final concentration of 30 µg ml−1. Each dot indicates an individual HLA class II allele. Binding of LAG-3, NKp30, NKp46 and KIR Fc constructs to HLA class II-coated beads was determined in one single experiment (n = 1). Binding of NKp44 Fc construct to HLA class II beads was determined in three independent biological replicates and MFI values of all experiments (n = 3) are depicted as mean values for each allele. The 95 HLA class II alleles were grouped according to HLA-DR, HLA-DQ and HLA-DP. The horizontal line shows the median of each HLA class II group. Error bars depict the interquartile range of each group. Statistical comparisons between HLA molecule types were done using data from each replicate in a mixed effects linear regression model. ****P < 0.0001. b, NKp44 Fc construct binding to different HLA-DP-coated beads was determined in three independent biological replicates and data of all independent experiments (n = 3) are depicted as MFI. Floating bars indicate the median, minimum and maximum MFI of each HLA-DP allele tested. HLA-DP molecules that exhibited higher binding to the NKp44 Fc construct than to the positive control in at least one assay are marked in red. c, Representative SPR sensorgrams (top row) and corresponding equilibrium binding curves (bottom row) of NKp44 binding to HLA-DP401 CLIP (left) and HLA-DP301 CLIP (right) molecules. Equilibrium dissociation constants (Kd) and s.e.m. were calculated from three independent analyte preparations (n = 3). Binding curve error bars represent the error of the fits by a single-site binding model. ND, not determined. RU, response unit. d, Representative SPR sensorgrams demonstrating no detectable binding between NKp44 and HLA-DQ2 CLIP, NKp46 and HLA-DP401 CLIP (top row); NKp46 and HLA-DQ2 CLIP; NKp46 and HLA-DP301 CLIP (bottom row). Data are representative of two (n = 2 for HLA-DQ2) or three (n = 3 for NKp46) independent experiments.