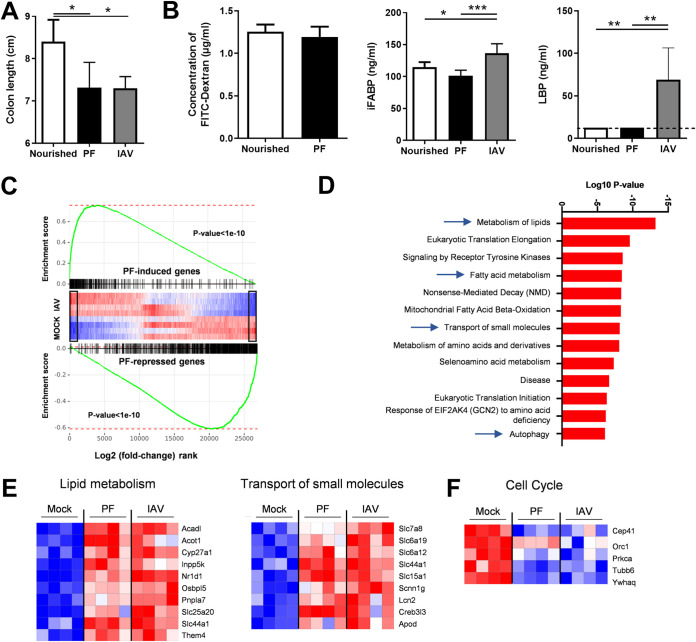
FIG 3.
Analysis of gut disorders in pair-fed mice. The food access was restricted in order to mimic the weight loss of IAV-infected mice (7 dpi, ∼15% of body mass). (A) The colon lengths of pair-fed mice and normally nourished mice were measured. (B) FITC-dextran, intestinal fatty acid-binding protein (iFABP), and LPS-binding protein (LBP) concentrations in the blood. (C and D) Analysis of gene expression in the colons of pair-fed mice and IAV-infected mice. (C) GSEA plot showing enrichment of pair-feeding (PF)-induced (top) and pair-feeding-repressed (bottom) genes in mock-treated and IAV-infected mice. Black rectangles indicate statistically significant differences in the mock-versus-IAV comparison. Global IAV and pair-feeding signatures appear statistically correlated. (D) Gene set enrichment analysis was run on pair-feeding (PF)-induced genes in a comparison with those in the mock condition (fold change, >2; adjusted P value < 0.05) using the Reactome database. (E, left) Heatmap showing significantly modulated genes (fold change, >2; adjusted P value < 0.05) related to lipid metabolism from the Reactome database’s “Metabolism of lipids,” “Fatty acid metabolism,” and “Mitochondrial Fatty Acid Beta-Oxidation” pathways. (E, right) Heatmap representing the expression of genes from the Reactome database’s “Transport of small molecules” pathway. (F) Heatmap representing the expression of genes from the Reactome database’s “Cell Cycle” pathway. (A and B) Significant differences were determined using the Kruskal-Wallis ANOVA test and the Mann-Whitney U test (FITC dextran) (n = 6 to 12) (*, P < 0.05; **, P < 0.01; ***, P < 0.001).

