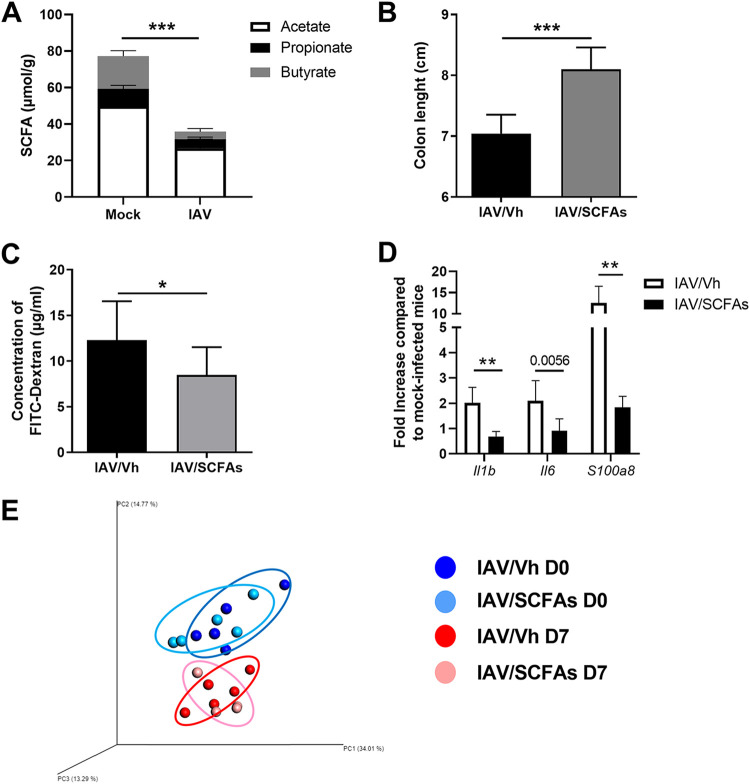
FIG 4.
Effect of SCFA supplementation during IAV infection on gut disorders. (A) Cecal concentrations of total and individual SCFAs in mock-treated and IAV-infected mice (7 dpi) (n = 7, one experiment out of at least six performed). (B to D) Mice were infected with IAV. Two days after infection, mice were treated with acetate, propionate, and butyrate (150 mM, 50 mM, 20 mM, respectively, in drinking water) or with vehicle (Vh). (B) The colon length was measured at 7 dpi (n = 6 to 9; one representative experiment out of two). (C) Fluorescence intensity quantified in the blood of mice 4 h after FITC-dextran oral administration (n = 14; two pooled experiments). (D) Gene expression in total liver was analyzed by RT-qPCR (n = 6; one representative experiment out of two). (E) Analysis of the gut microbiota’s composition was performed on feces collected from uninfected mice treated (bright blue) or not (dark blue) with SCFAs for 5 days and from mice infected 7 days earlier with IAV and treated (pink) or not (red) with SCFAs at 2 dpi (n = 4 to 5). Bacterial communities were clustered using PCoA of weighted UniFrac distance matrices (beta diversity). The first three principal coordinates (PC1, PC2, and PC3) are plotted for each sample, and the percentage variation in the plotted principal coordinates is indicated on the axes. Each spot represents one sample, and each group of mice is denoted by a different color. The distance between dots represents the extent of compositional difference. D0 and D7, days 0 and 7. Significant differences were determined using the Mann-Whitney U test (A to C) and the Kruskal-Wallis ANOVA test (D) (*, P < 0.05; **, P < 0.01, ***, P < 0.001).

