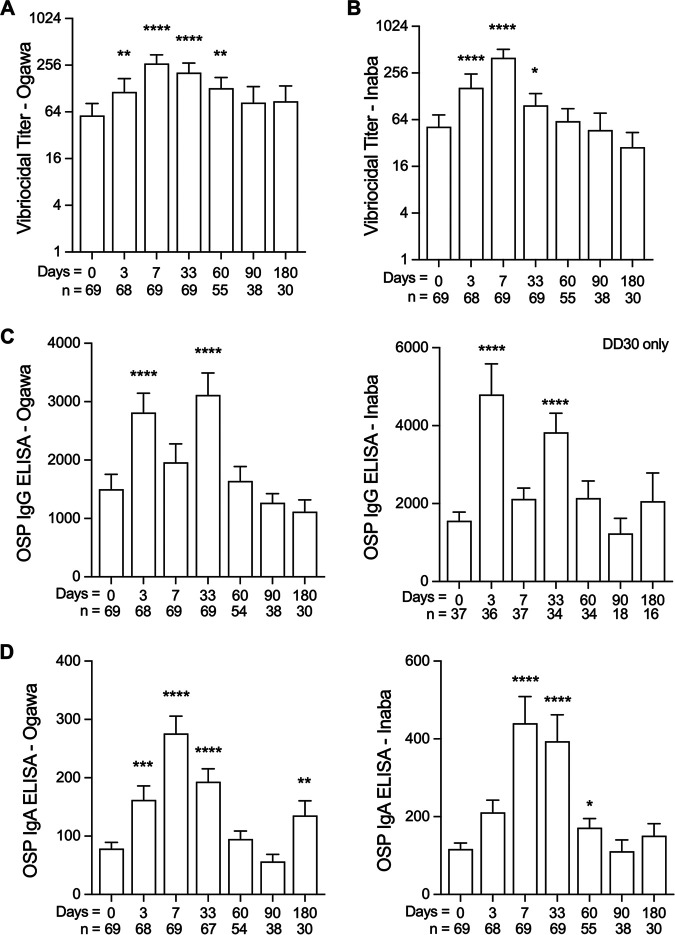
FIG 1.
Vibriocidal titers and IgG and IgA antibody responses in study participants. (A and B) Ogawa (A) and Inaba (B) specific vibriocidal titers at day 0 through day 180 are shown. Day 0 is the date of administration for the initial vaccine dose. (C) IgG OSP-specific antibodies to Ogawa and Inaba serotypes. (D) IgA OSP-specific antibodies to Ogawa and Inaba serotypes. Vibriocidal titers are presented as geometric means with bars representing 95% confidence interval on a log2 scale. Mean values of OSP antibodies are shown with bars representing standard error of the mean (SEM). Mann-Whitney testing was performed and asterisks denoting statistically significant differences from baseline levels are shown; *, P < 0.05; **, P < 0.01; ***, P < 0.001; ****, P < 0.0001.

