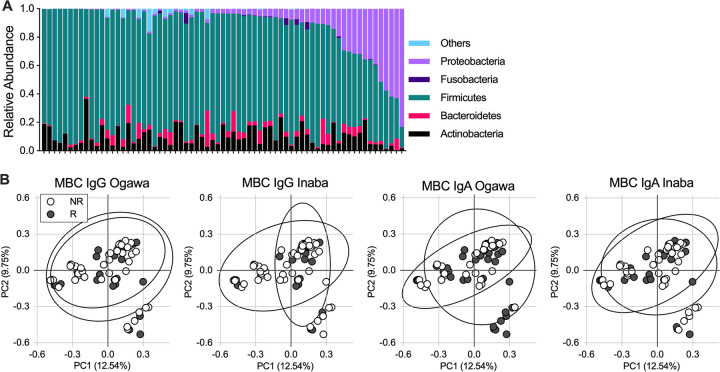
FIG 3.
Microbiota composition at the time of vaccination in participants stratified by MBC response. (A) Phylum level abundance on the date of administration for the initial vaccine dose in each participant (baseline). (B) Principal-component analysis (PCoA) of beta diversity measured by Bray Curtis dissimilarity of MBC nonresponders (NR) and responders (R) by antibody isotype and V. cholerae serotype. Columns in (A) and dots in (B) represent a single participant with ellipses (B) representing the 95% confidence interval. Statistical testing of all four PCoA values using analysis of molecular variance (AMOVA) was not significant (P > 0.05).

