
FIG 2.
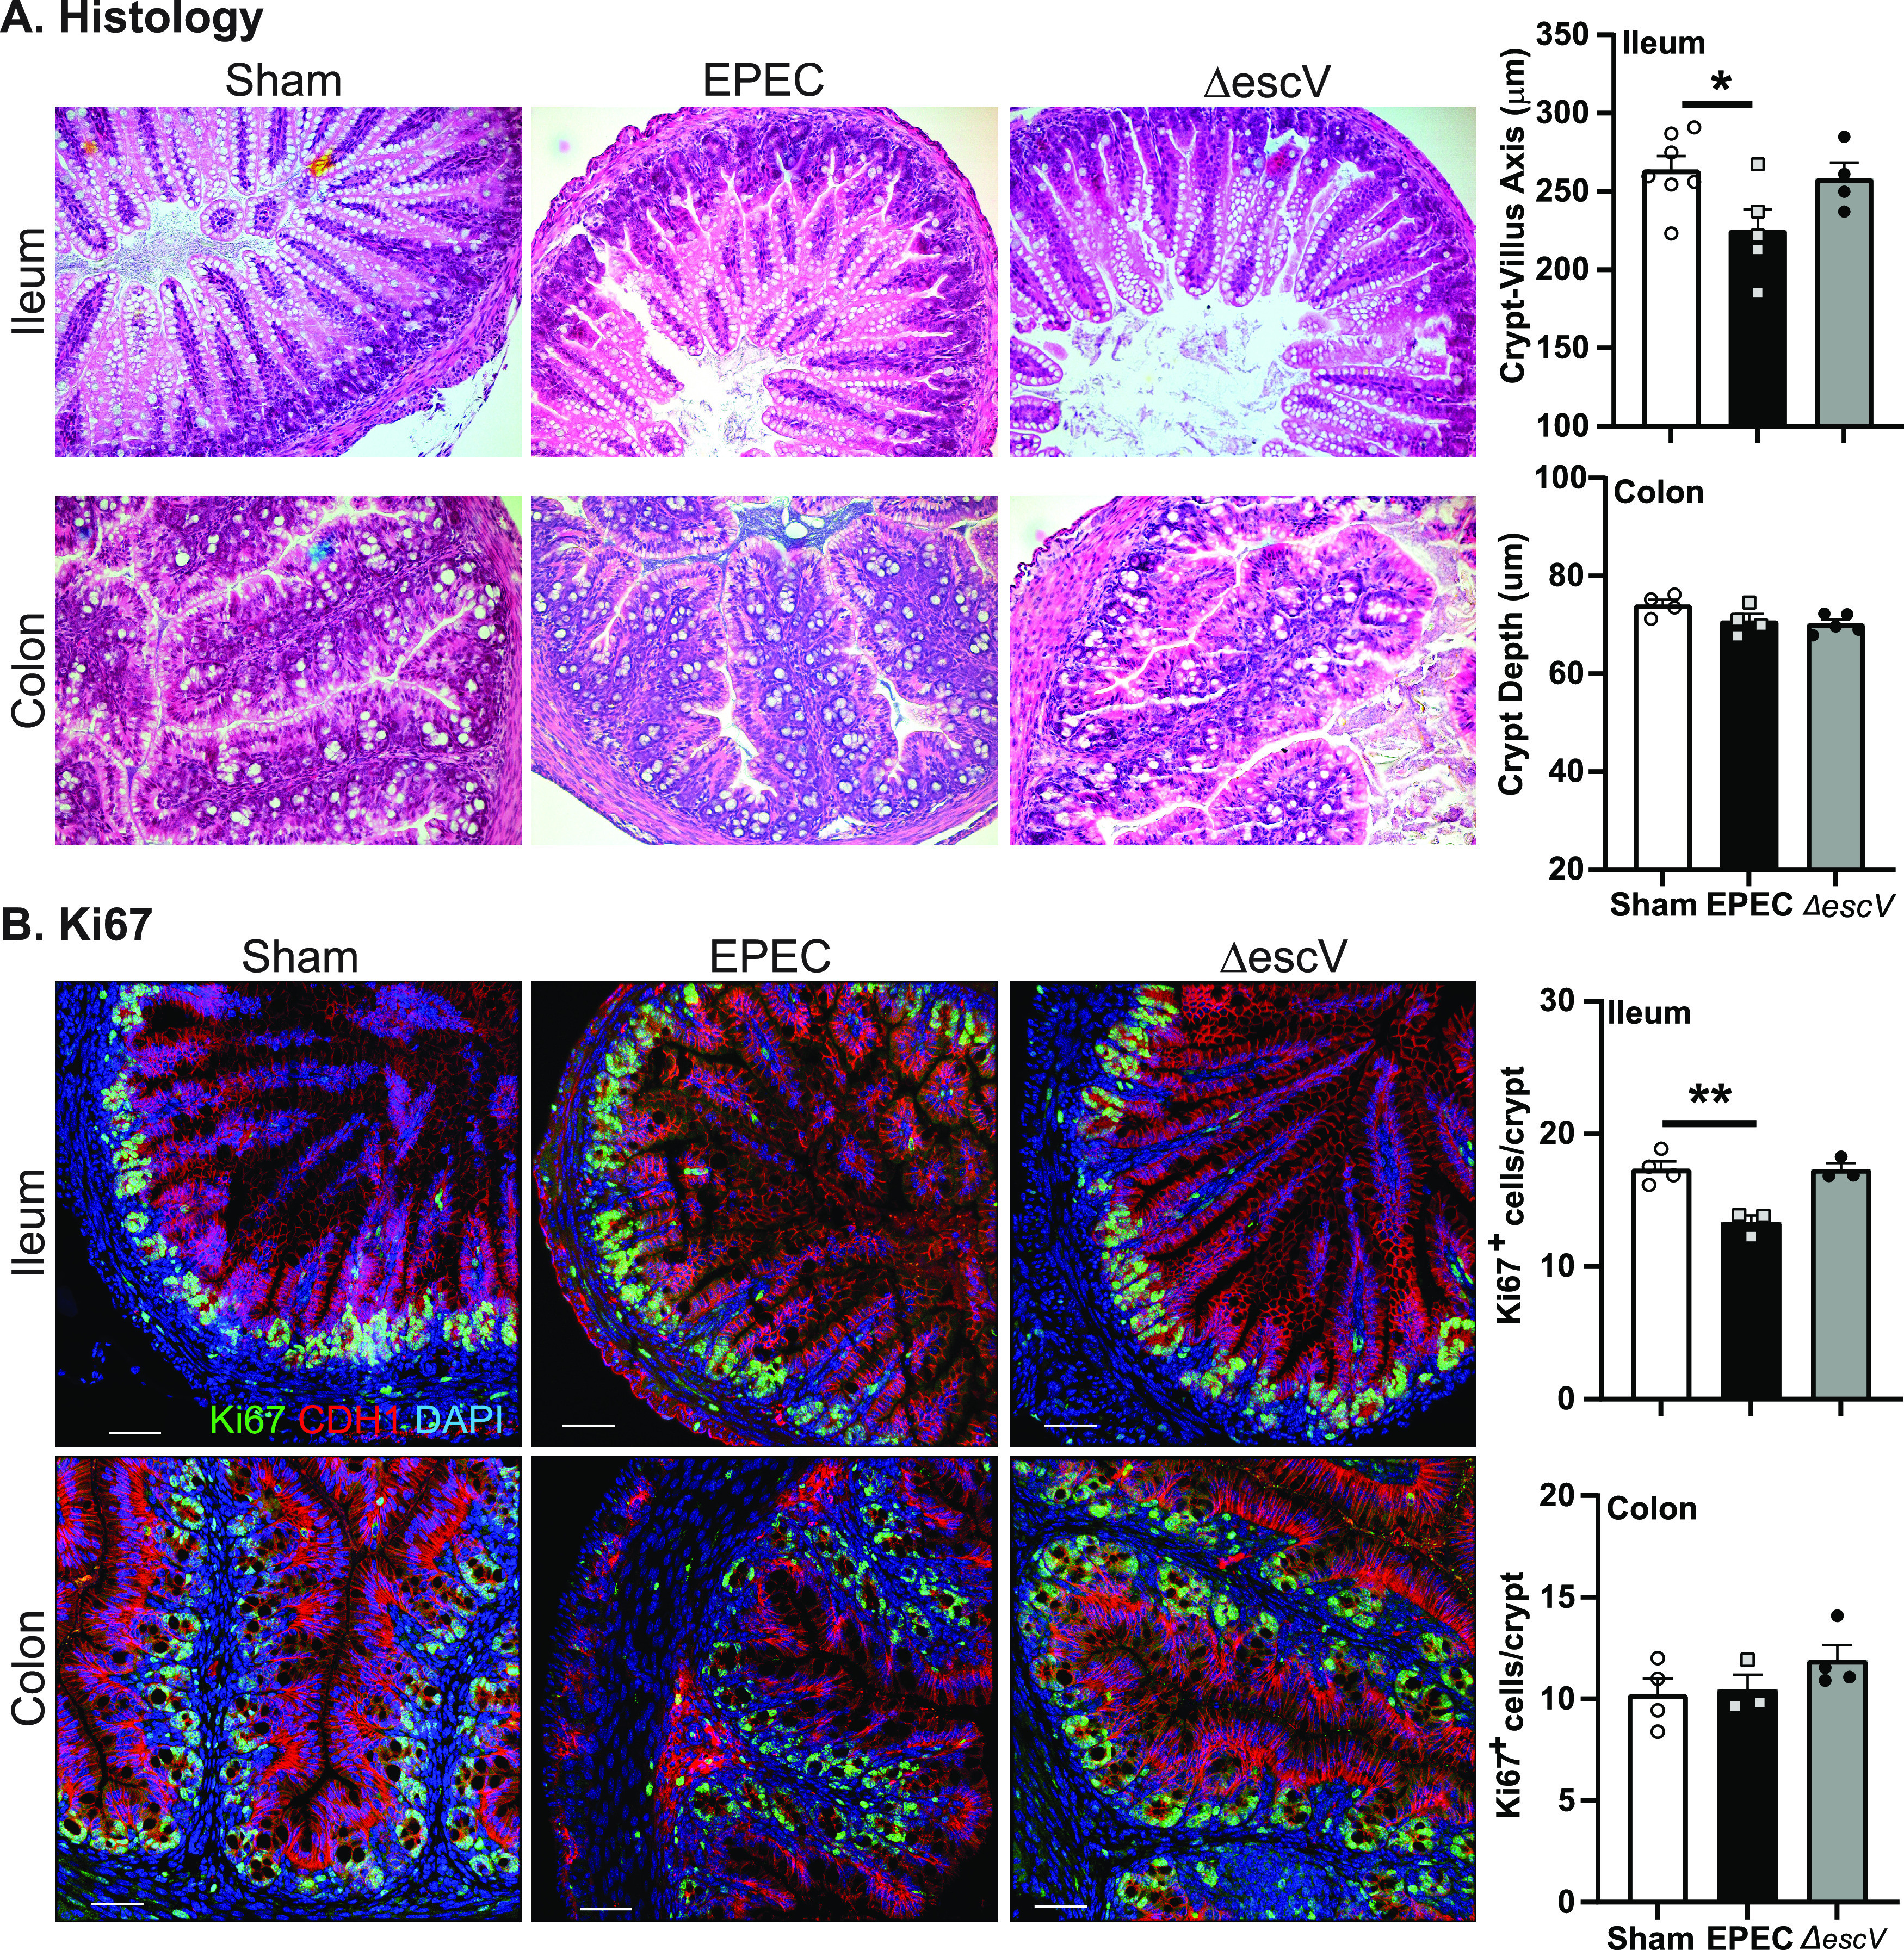
Neonatal GI histology. (A) Representative histological images (H&E staining) of ileum and colon from sham-, EPEC-, and ΔescV-challenged mice at 7 days postinfection (left) and quantification of the crypt-villus axis (ileum) and crypt depth (colon) (right). (B) Representative images of epithelial cell proliferation assessment by Ki67 (proliferation marker) (green), CDH1 (epithelial cell marker) (red), and DAPI (nuclei) (blue) in the ileum and colon (left) and quantification of cell numbers (right) (n = 3 to 5 mice per group) (*, P ≤ 0.05; **, P ≤ 0.01 [by one-way ANOVA and Tukey’s post hoc test]). Bars = 100 μm.