
Figure 1.
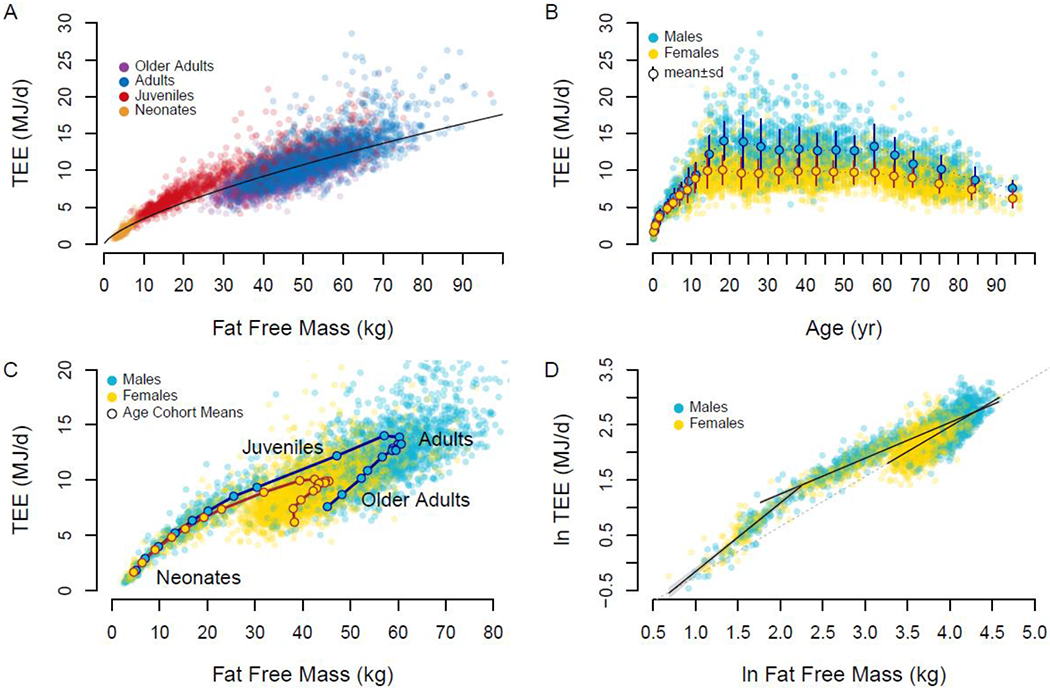
A. Total expenditure (TEE) increases with fat free mass in a power-law manner, but age groups cluster about the trend line differently. B. Total expenditure rises in childhood, is stable through adulthood, and declines in older adults. Means±sd for age-sex cohorts are shown. C. Age-sex cohort means show a distinct progression of total expenditure and fat free mass over the life course. D. Neonate, juveniles, and adults exhibit distinct relationships between fat free mass and expenditure. The dashed line, extrapolated from the regression for adults, approximates the regression used to calculate adjusted total expenditure.