
Figure 2.
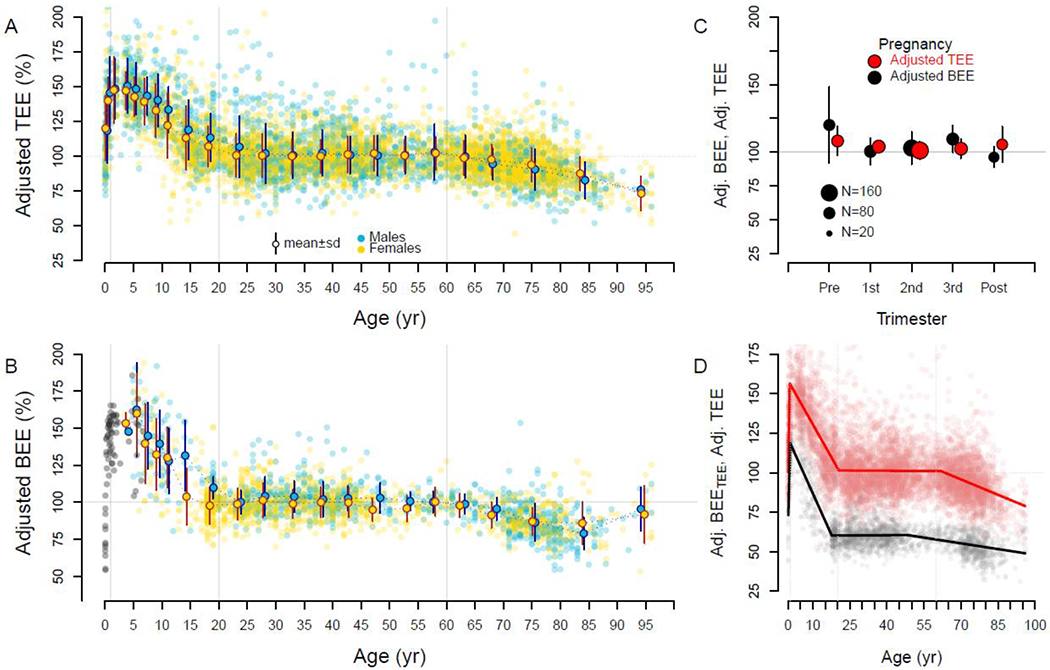
Fat free mass- and fat mass-adjusted expenditures over the life course. Individual subjects and age-sex cohort mean ± SD are shown. For both total (Adj. TEE) (A) and basal (Adj. BEE) expenditure (B), adjusted expenditures begin near adult levels (~100%) but quickly climb to ~150% in the first year. Adjusted expenditures decline to adult levels ~20y, then decline again in older adults. Basal expenditures for infants and children not in the doubly labeled water database are shown in gray. C. Pregnant mothers exhibit adjusted total and basal expenditures similar to non-reproducing adults (Pre: prior to pregnancy; Post: 27 weeks post-partum). D. Segmented regression analysis of adjusted total (red) and adjusted basal expenditure (calculated as a portion of total; Adj. BEETEE; black) indicates a peak at ~1 y, adult levels at ~20 y, and decline at ~60 y (see text).