
Figure 3.
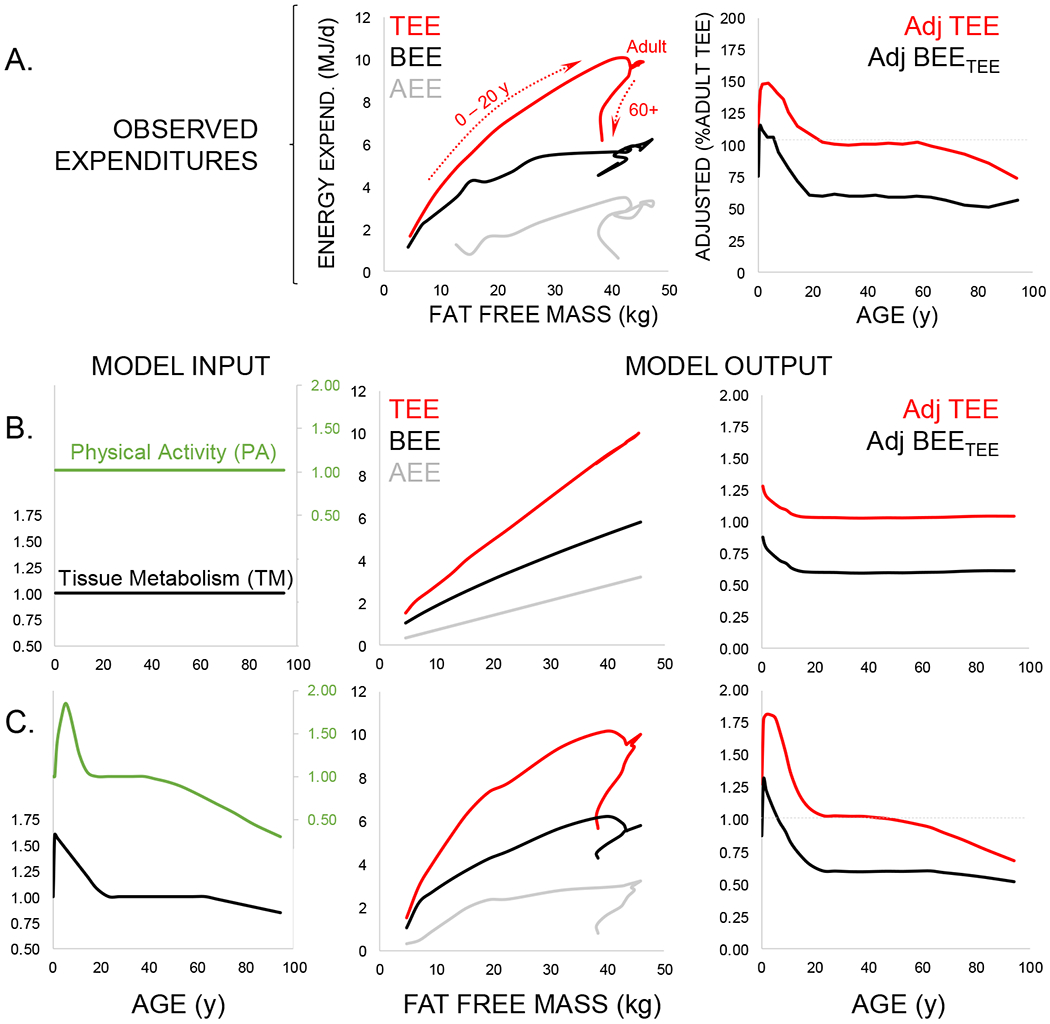
Modeling the contribution of physical activity and tissue-specific metabolism to daily expenditures. A. Observed total (TEE, red), basal (BEE, black), and activity (AEE, gray) expenditures (Table S1) show age-related variation with respect to fat free mass (see Figure 1C) that is also evident in adjusted values (Table S3; see Figure 2D). B. These age effects do not emerge in models assuming constant physical activity (PA, green) and tissue-specific metabolic rate (TM, black) across the life course. C. When physical activity and tissue-specific metabolism follow the life course trajectories evident from accelerometry and adjusted basal expenditure, respectively, model output is similar to observed expenditures.