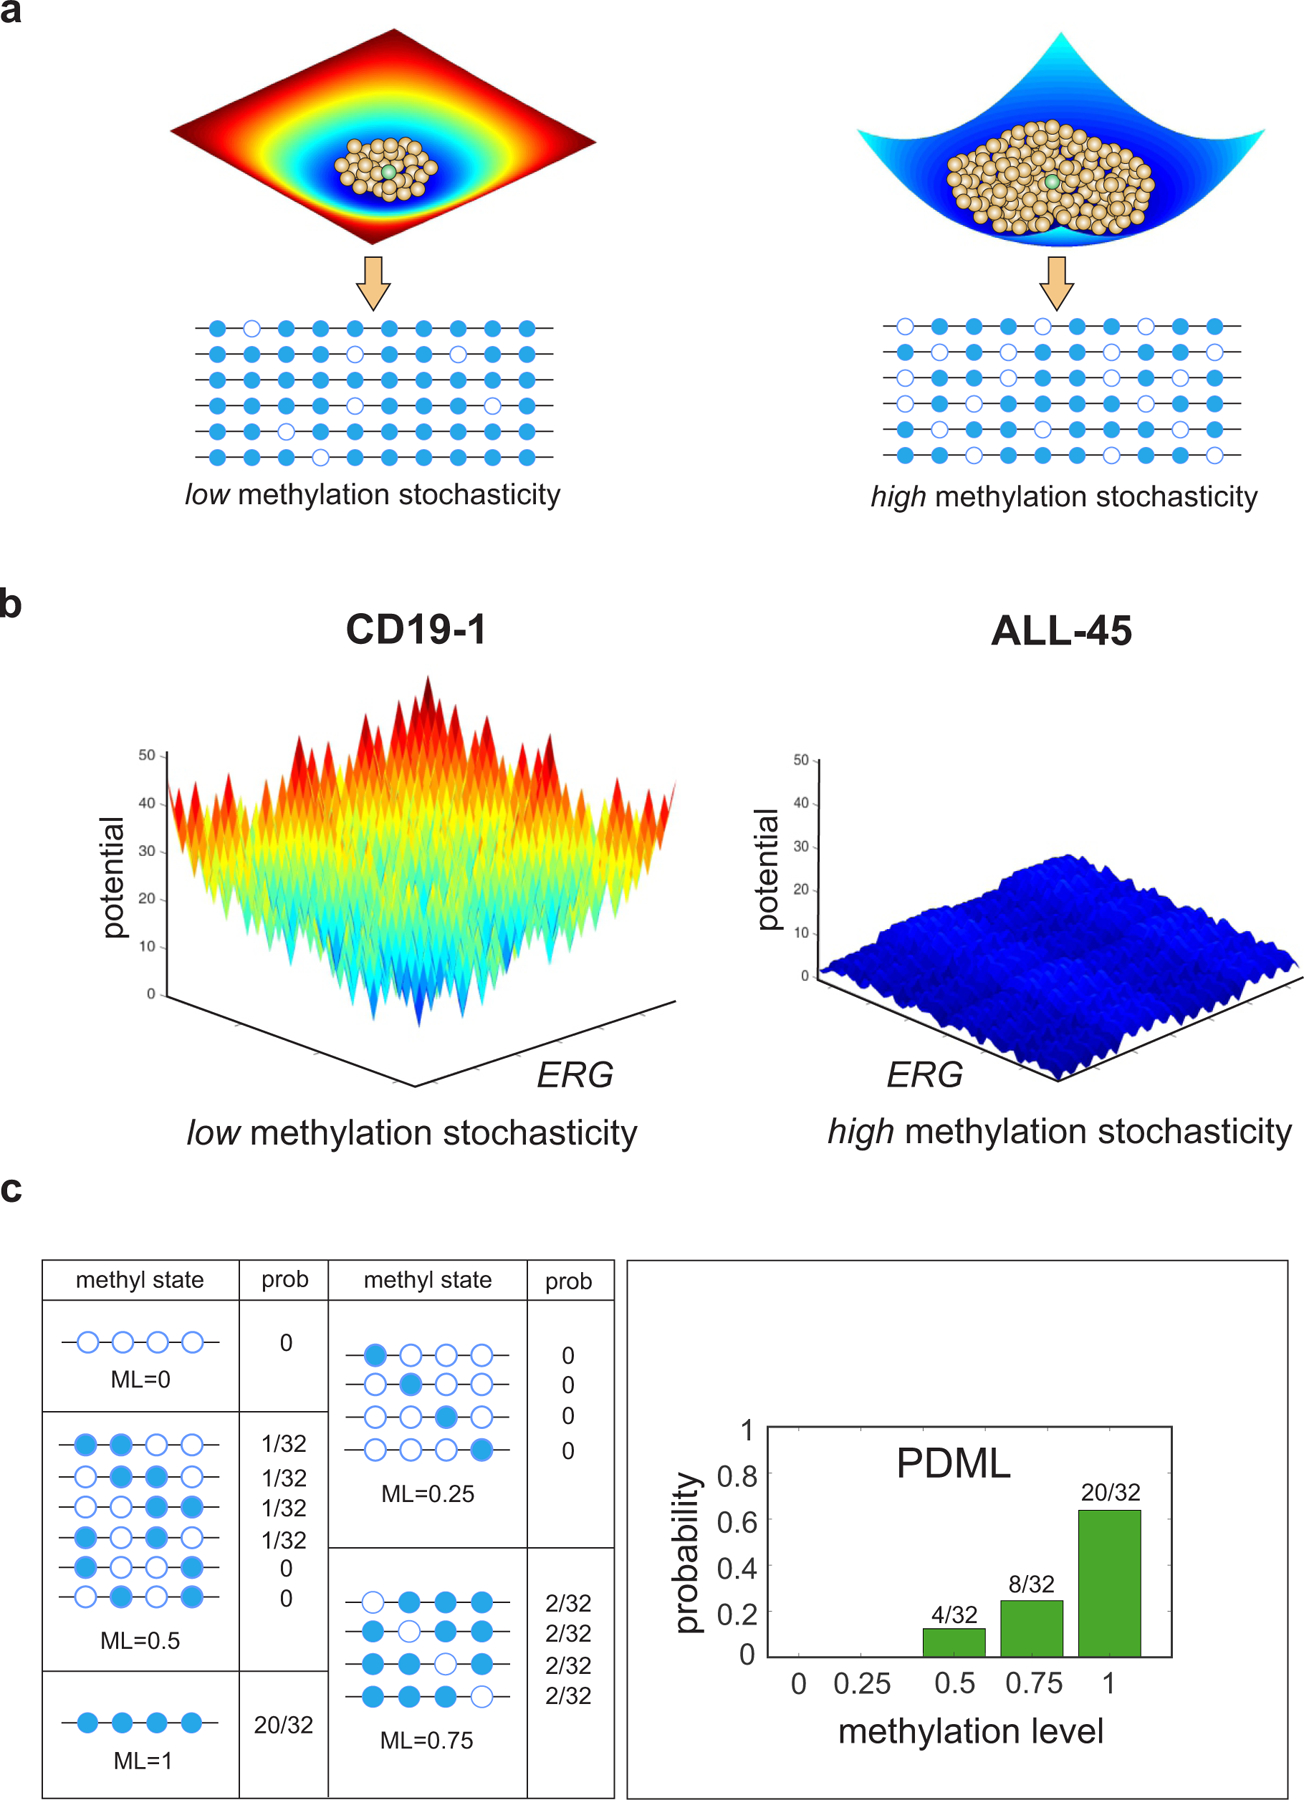
Fig. 1 |. Potential energy landscapes explain DNA methylation stochasticity in normal and cancer cells.

a, Illustration of potential energy landscapes. Each methylation pattern (brown balls) is assigned a potential value that provides a measure of its improbability to be observed relative to the most probable pattern (green ball), which is assigned zero potential. A deep and narrow ‘potential well’ indicates low methylation stochasticity in a cell population (left), whereas a shallow and wide ‘potential well’ points to high methylation stochasticity (right). b, Potential energy landscapes associated with twelve contiguous CpG sites within ERG [chr21: 39,830,065 – 39,830,570] demonstrate increased methylation stochasticity for ERG in ALL, in agreement with observed WGBS data (Supplementary Fig. 2). Here the methylation patterns are assigned to points in a two-dimensional state-space using Gray’s code (Methods). c, Within an analysis region, methylation patterns are grouped in terms of their methylation level (ML). The probability distribution of the methylation level (PDML) is then evaluated by summing the probabilities associated with the methylation patterns within each group. The depicted probability distribution points to an analysis region that is most likely methylated.
