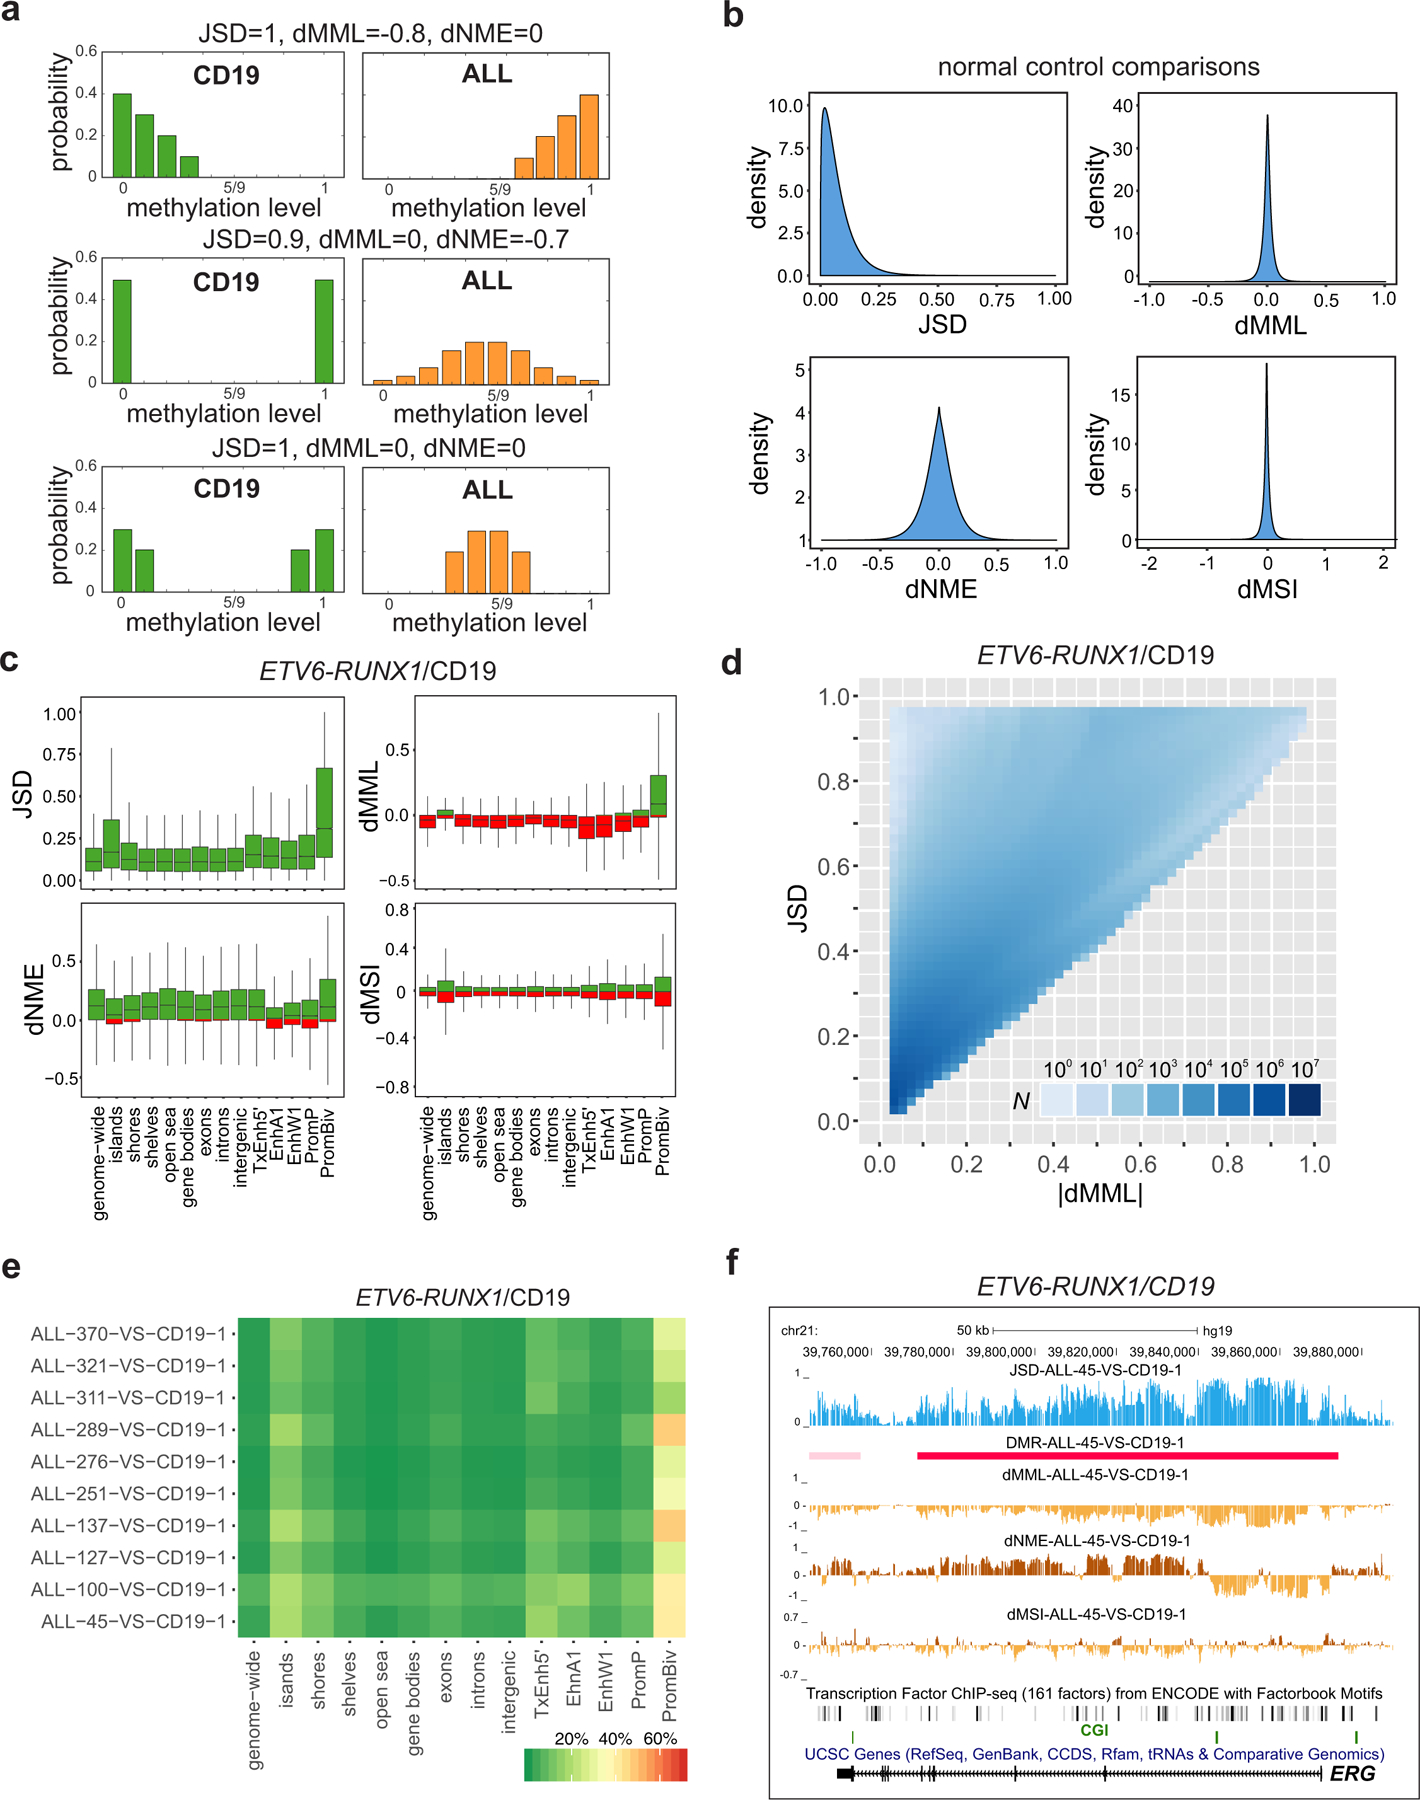
Fig. 2 |. Differential analysis localizes methylation discordance in ALL.

a, The Jensen-Shannon distance (JSD) captures methylation discordance within an analysis region by evaluating differences in the location and shape of the probability distributions of the methylation levels associated with a test (ALL) and a reference (CD19/pre-B2) sample. Methylation discordance can be due to a difference in mean methylation level (dMML – top row), in normalized methylation entropy (dNME – middle row), or due to other statistical factors (bottom row). b, Densities of JSD, dMML, and dNME, as well as of differences in the values of the methylation sensitivity index (dMSI), when comparing all normal CD19 and pre-B2 samples, show relatively small discordances associated with biological, statistical, and technical variability in these samples. c, Distributions of JSD, dMML, dNME, and dMSI values genome-wide and within selected genomic features in an ETV6-RUNX1/CD19 comparison (ALL-45 vs. CD19–1). Green, positive values; red, negative values; center lines, median; boxes, interquartile range (IQR); whiskers, 1.5 × IRQ. d, Distribution of the number of analysis regions with respect to their JSD and absolute dMML values, computed from all ETV6-RUNX1/CD19–1 comparisons genome-wide. Many analysis regions that exhibit similar absolute differences in mean methylation level are associated with a wide range of Jensen-Shannon distance values demonstrating that the mean methylation level is not the only statistical factor influencing methylation discordance in ALL. e, Percentage of analysis regions with significant methylation discordance within selected genomic features when comparing ETV6-RUNX1 ALL with CD19. f, UCSC genome browser images of a chromosomal region associated with ERG exhibiting significant Jensen-Shannon distance values in an ETV6-RUNX1/CD19 comparison (ALL-45 vs. CD19–1), and thus being significantly informative of the phenotype. This region exhibits consistent reduction in mean methylation level and loss in methylation sensitivity, but localized gain or loss in normalized methylation entropy.
