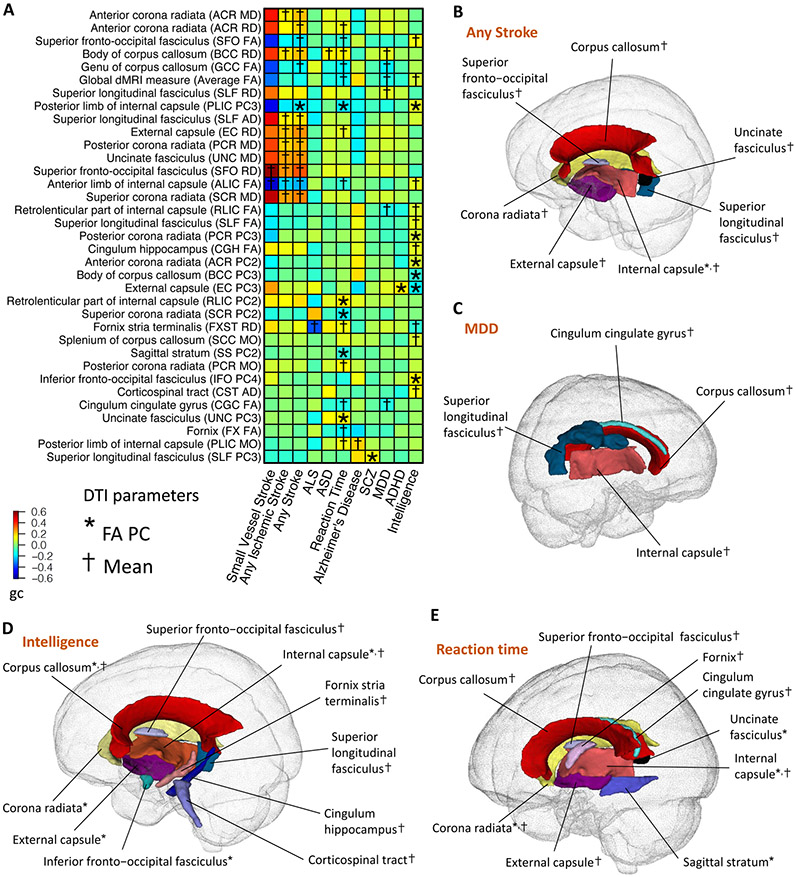
Fig. 4. Selected pairwise genetic correlations between DTI parameters of white matter tracts and brain disorders and cognitive functions.
(A) The asterisks (for FA PCs) and daggers (for mean parameters) highlight significant genetic correlations after controlling the FDR at 5% level. The y-axis lists the DTI parameters of white matter tracts and the x-axis provides the names of brain-related traits/disorders. The colors represent genetic correlations (gc). FA, fractional anisotropy; AD, axial diffusivity; MD, mean diffusivity; MO, mode of anisotropy; RD, radial diffusivity; PC, principal component of FA; ALS, amyotrophic lateral sclerosis; ASD, autism spectrum disorder; MDD, major depressive disorder; SCZ, schizophrenia; ADHD, attention-deficit/hyperactivity disorder. (B-E) Location of the white matter tracts whose DTI parameters were genetically correlated with (B) stroke (any subtype); (C) MDD; (D) intelligence; and (E) reaction time. The colors describe different white matter tracts.

